


Enrollment Trends at AACSB Business Schools: 2025
This report provides an in-depth look at undergraduate and master’s enrollment trends using data from AACSB-accredited schools that participated in the Business School Questionnaire (BSQ) Programs Module, including the most recent 2024–25 results. It addresses some of the most common questions about business school enrollment patterns and highlights emerging shifts influencing today’s business education environment.
To ensure meaningful year-over-year comparisons, the analysis focuses on a controlled group of institutions that have consistently reported data across the selected time period. While this approach reduces the overall sample size, it provides a clearer and more reliable view of how enrollment patterns are truly evolving.
Executive SummaryEnrollment trends at AACSB-accredited business schools indicate a business education market that is not declining but rather transforming. Demand remains strong, yet students are making more deliberate choices. Enrollment is stable, but it shifts across program types. Gender representation has been steady. International mobility is increasingly influenced by external geopolitical forces, and program delivery continues to evolve to meet learner expectations. As business schools navigate this environment, strategic clarity and adaptability will be essential. Institutions that understand these shifts and respond with flexible design, student-centered experiences, and globally informed recruitment strategies will be best positioned to thrive in the next era of business education. Demand for Business EducationWhile undergraduate and master’s programs continue to attract strong interest from prospective students, the data indicate a more cautious conversion from interest to actual enrollment. At the undergraduate level, applications increased by 38 percent over five years, accompanied by a 30 percent rise in offers and a more modest 10 percent increase in new entrants. Master’s-level demand follows a similar pattern: applications grew by 25 percent, but new entrants increased by 6 percent, suggesting heightened competition and expanded options for prospective students. Across both levels, schools report increasingly complex decision-making among applicants as they navigate program types, delivery formats, and institutional profiles. Enrollment Trends
Gender Trends
International Student Trends
Program Delivery Trends
|
The Enrollment Landscape
We begin with a snapshot of AACSB’s most recent global enrollment data for the 2024–25 academic year. This overview highlights enrollment across degree programs at AACSB-accredited schools and provides context for understanding the current business education landscape.
2024–25 Snapshot of Enrollment Counts by Program
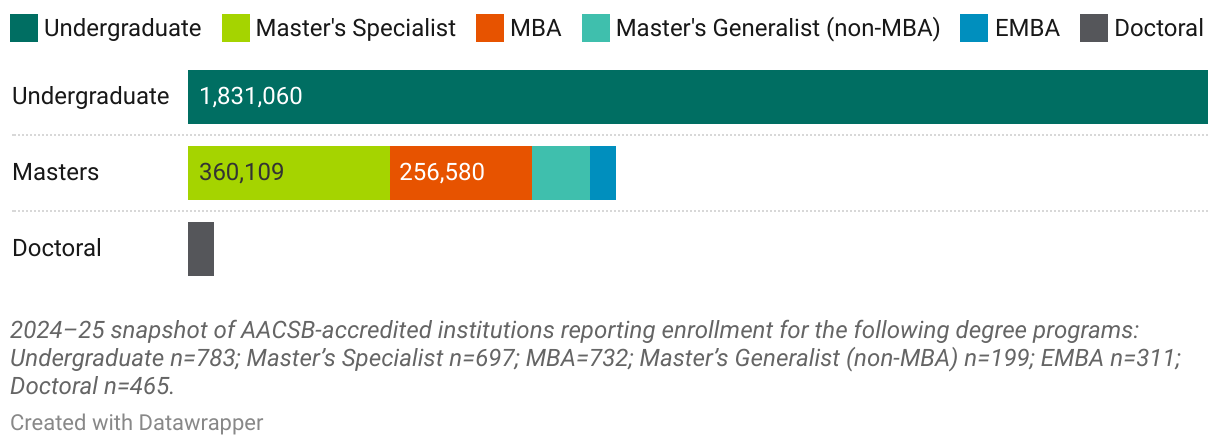
The remainder of this report focuses on the undergraduate and master’s levels, the latter of which includes the MBA, master’s generalist (non-MBA), and master’s specialist degrees. Throughout the report, we explore these program categories in greater depth, examining the trends, regional variations, and demographic changes that are shaping the enrollment landscape. Stay tuned for upcoming reports that will provide a closer look at developments at the doctoral level.
Insights From Members on Enrollment Drivers
In fall 2025, AACSB surveyed its member schools to better understand the factors shaping international and overall enrollment. Respondents were presented with a list of potential influences and asked to select up to three that were currently having the greatest impact on their institution’s overall enrollment trends.
AACSB Members Share: Greatest Influences on Overall Enrollment
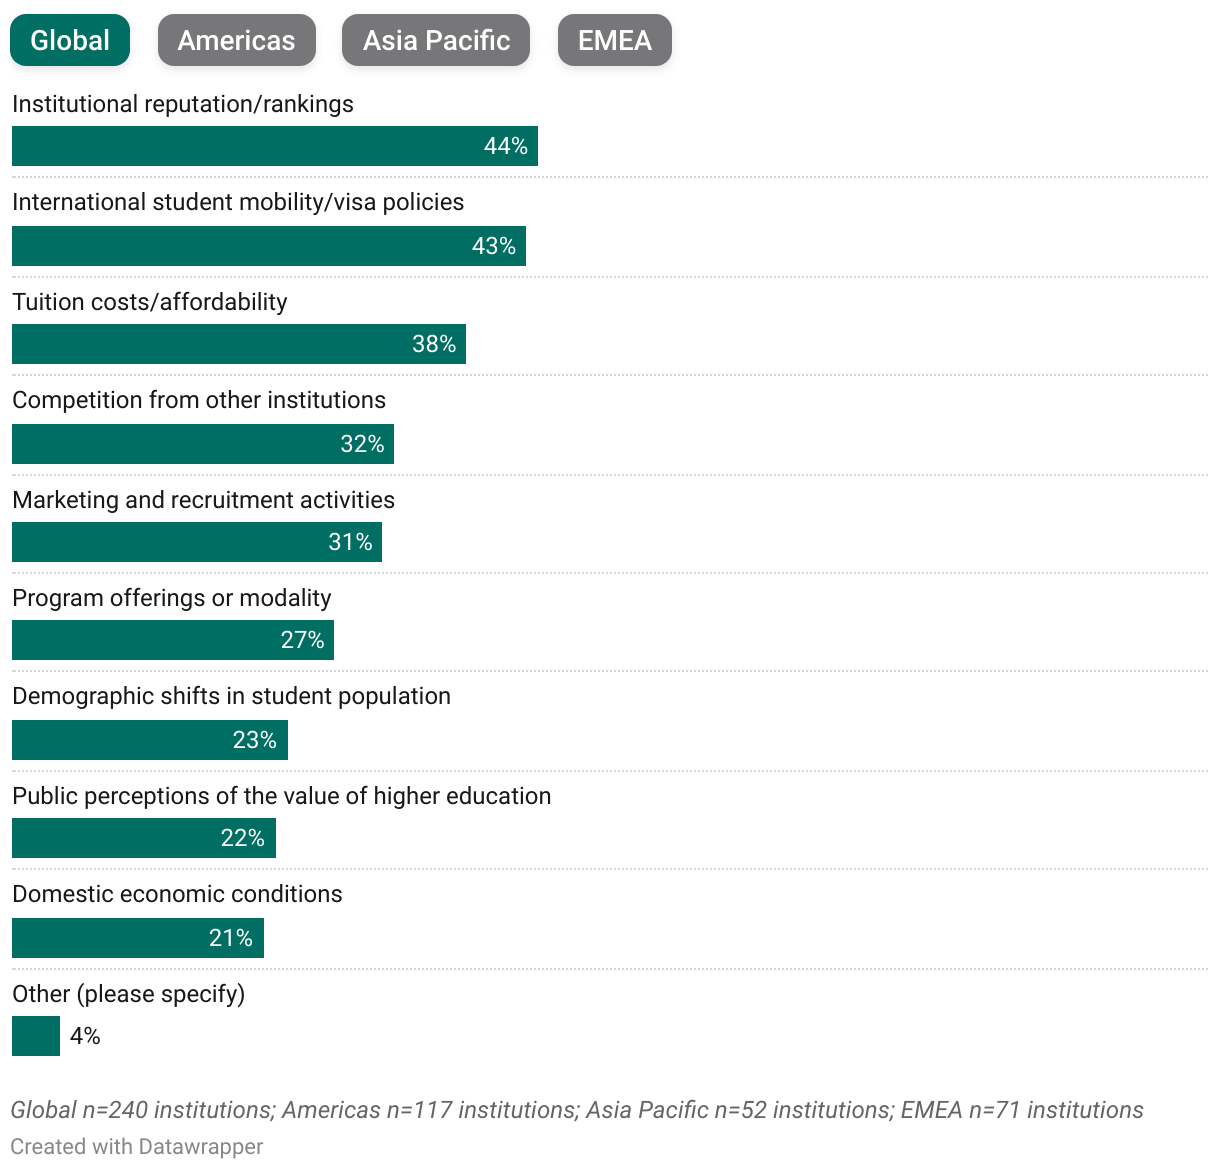
Overall, member schools regard institutional reputation and rankings, followed closely by international student mobility and visa policies, as the most influential factors—each cited by more than 40 percent of respondents. Tuition costs and affordability also present major concerns (38 percent). In contrast, less than one-quarter of respondents identify demographic or economic conditions among their top three influences, suggesting that schools view these pressures as secondary to competitive positioning and global mobility dynamics.
Regionally, several notable differences surface:
- Americas: International mobility and visa policies is most frequently selected as a top enrollment influencer, followed by tuition costs and affordability. Reputation and rankings appear less influential compared to schools in Asia Pacific and EMEA.
- Asia Pacific: Only one-quarter of schools selected international mobility and visa policies as a top-three factor, distinctly lower than reported in the other two regions.
- EMEA: More than half of respondents identify institutional reputation and rankings in their top three influences. Additionally, nearly 40 percent of schools indicate that marketing and recruitment activities played a significant role in enrollment behaviors.
Exclusive to AACSB members, the Analytics Hub has been completely redesigned with a modern interface, new functionality, and full mobile responsiveness, making it easier than ever to explore AACSB’s business education data from any device.
Members can now dig deeper into the data featured throughout this report, and more, by filtering directly within each dashboard, eliminating the need to set up comparison groups in advance. Plus, users can save bookmarks of their favorite views and access them instantly from a personalized home screen.
Now is the perfect time to see what’s new in the Analytics Hub!
| Explore Data |
Demand for Business Programs
While demand for undergraduate and master’s business programs has been stable, schools are experiencing a more cautious conversion from student interest to actual enrollment. This section analyzes five-year trends in demand, offering a closer look at how applications and admissions have evolved over time.
Undergraduate Programs
5-Year Trends of Undergraduate Program Admissions
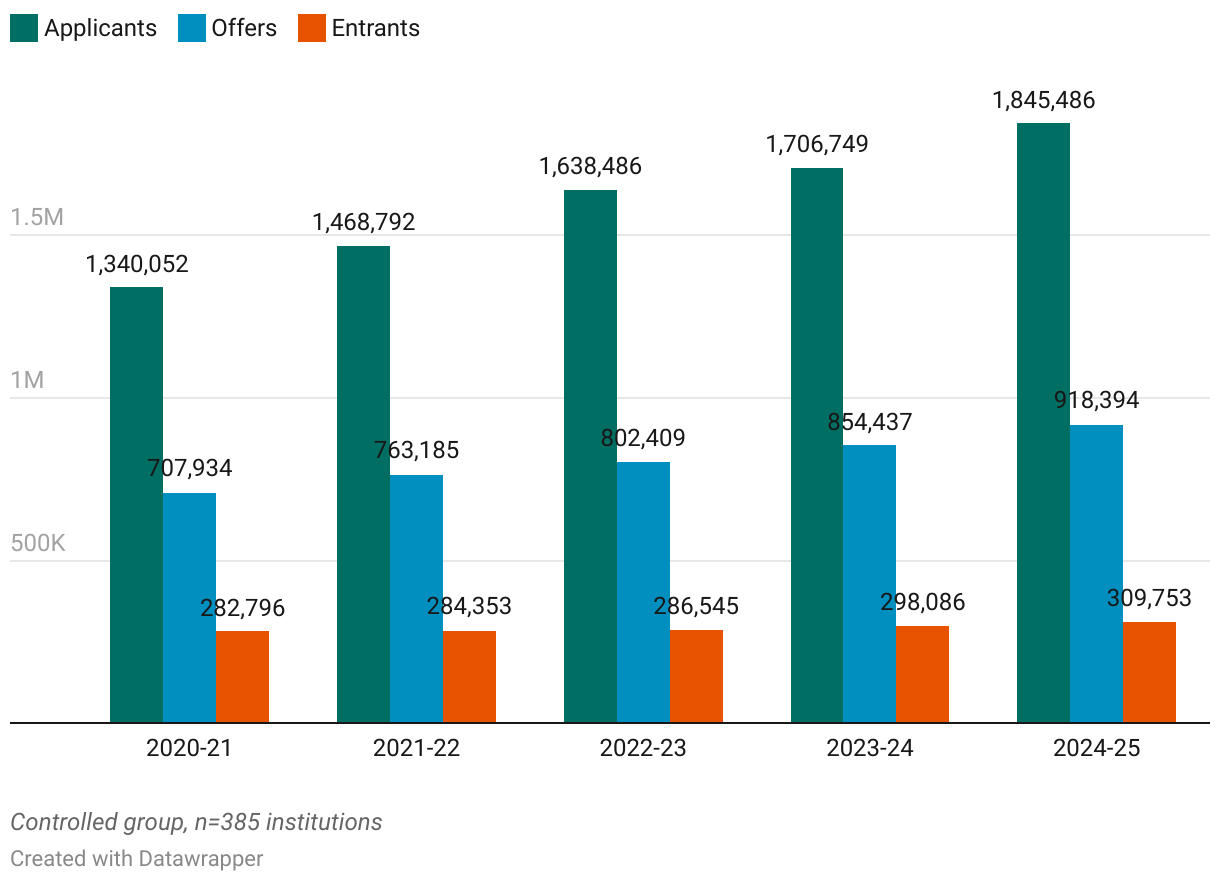
Over the past five years, undergraduate applications have shown steady momentum. The total number of applicants increased by 38 percent since 2020–21, reflecting an average annual growth rate of 8 percent. Offers move upward at a similar pace, increasing by 30 percent across that time frame, with an annual growth rate of 7 percent.
Growth among new entrants is more modest. Entrants increased by 10 percent over the five-year period, resulting in an annual growth rate of 2 percent. The slower increase in new entrants compared with applications and offers suggests that students may be considering more choices during the enrollment process.
Regional Trends: Undergraduate
Percentage of Total Undergraduate Applicants Across Regions
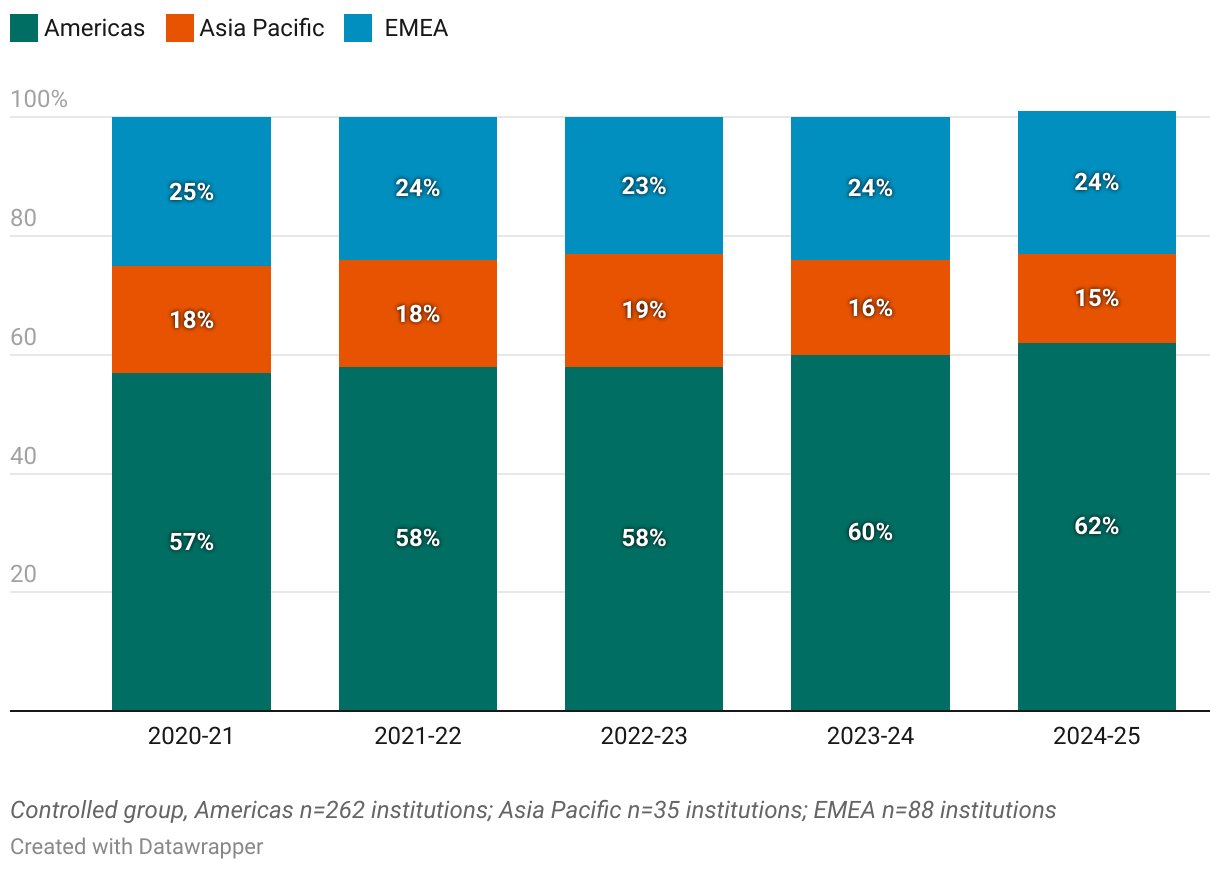
Within this sample, total undergraduate applications remain concentrated in the Americas, where the regional share increased steadily from 57 to 62 percent over the five-year period. EMEA has a stable portion of applications, at about 24 percent, and Asia Pacific shows higher participation in the first three years of the trend, followed by a gradual decline in the most recent two years, resulting in 15 percent of all undergraduate applications.
Admissions Trends: Undergraduate
The following charts provide key insights into admissions trends at the undergraduate level, focusing on two important metrics: acceptance rates and admissions yields. These metrics, which also apply to master’s-level trends later in this section, play a crucial role in understanding institutional competitiveness and student decision-making.
|
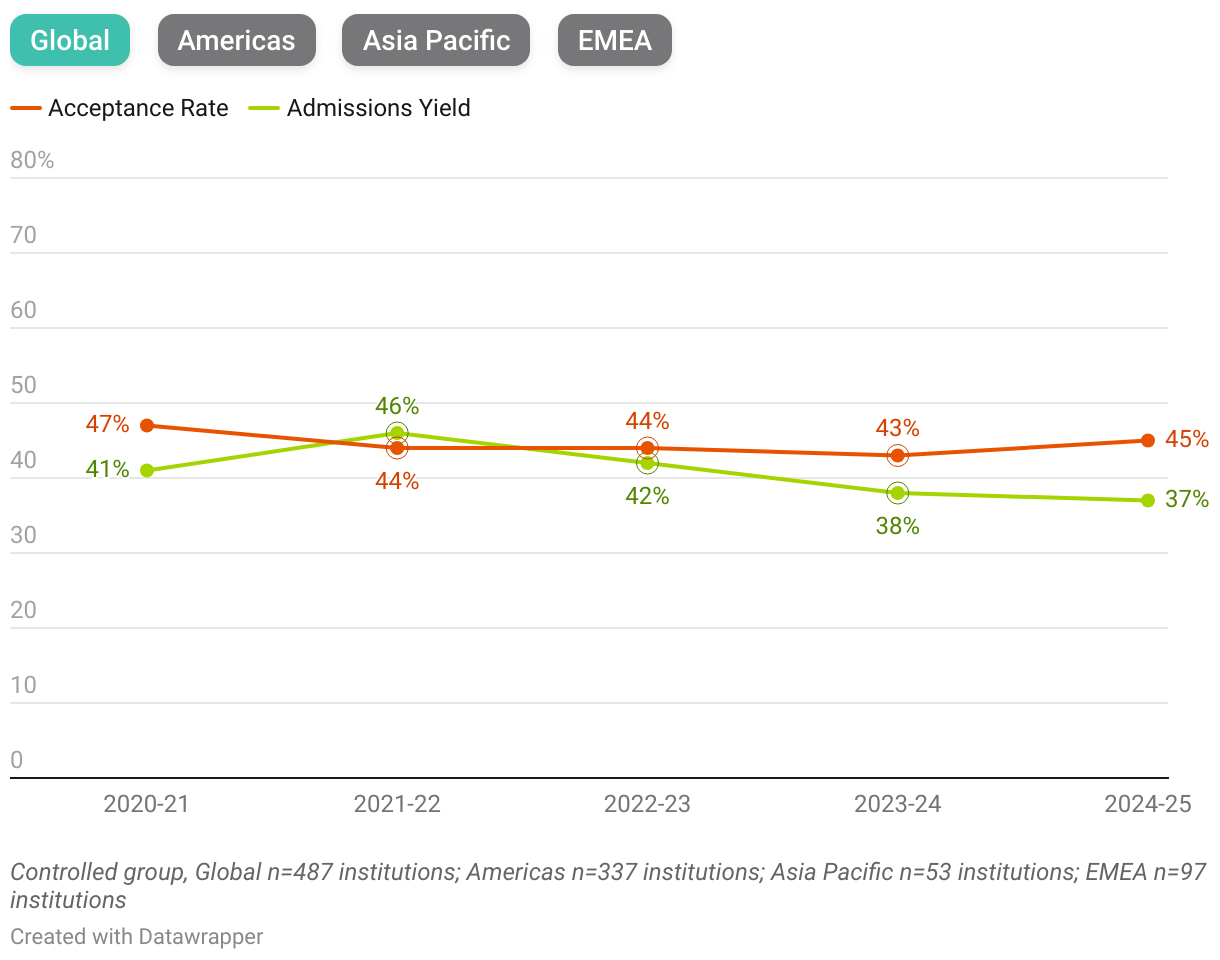
Undergraduate Acceptance Rate vs. Admissions Yield by Region
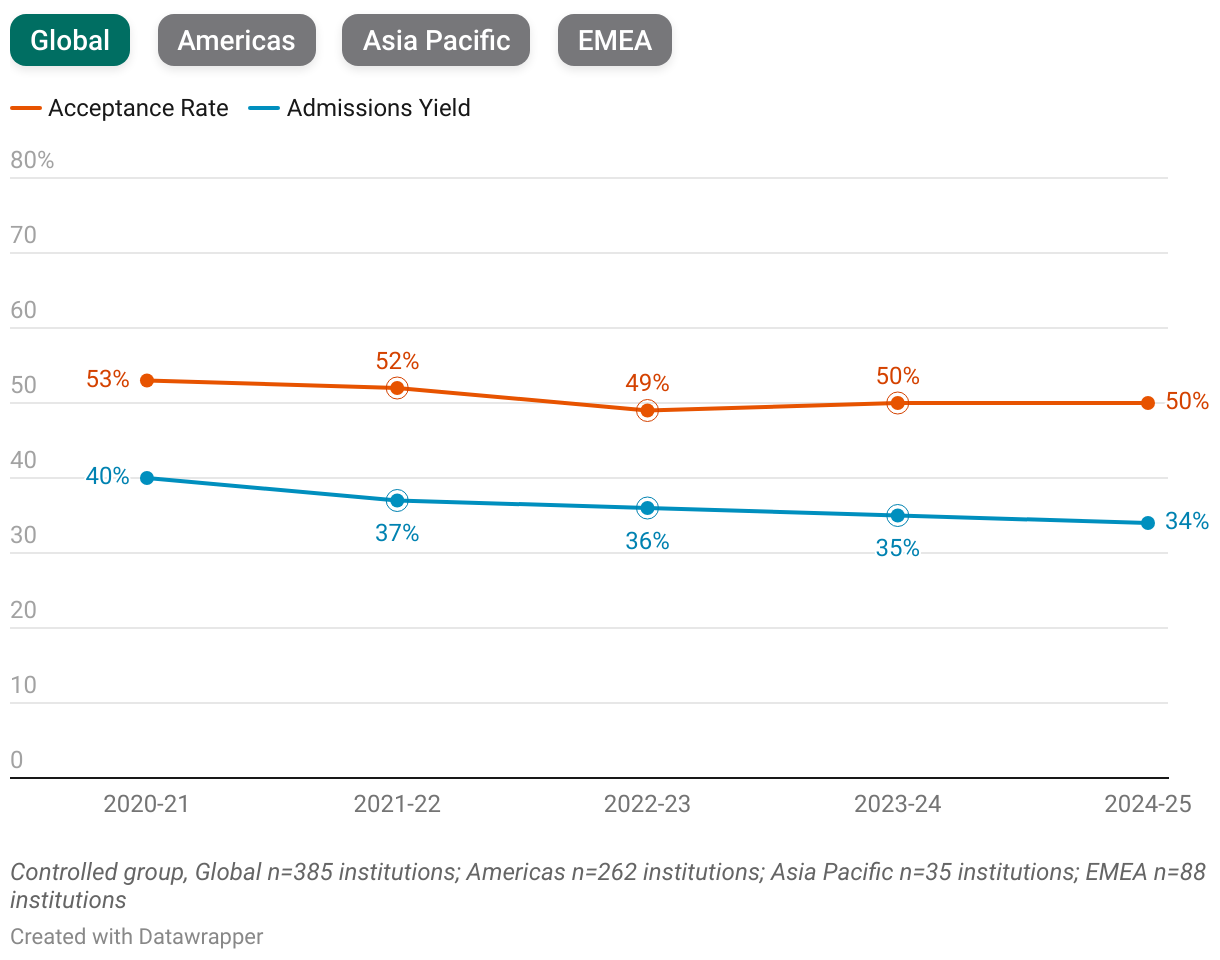
Undergraduate acceptance rates in the Americas and EMEA declined slightly over the five-year period, and admissions yields follow a similar downward trend. EMEA maintained a moderately higher yield than the Americas throughout the time frame, suggesting that a marginally larger share of admitted undergraduate students in that region chose to enroll.
Asia Pacific shows a contrasting pattern. Undergraduate admissions yields consistently remained higher than acceptance rates, indicating that students who received offers were more likely to enroll in this region than in the others. This trend suggests a comparatively stronger commitment among admitted undergraduates in Asia Pacific, even as acceptance rates fluctuated. Additionally, the region’s acceptance rates are notably lower than those in the Americas and EMEA, reflecting a more selective admissions process overall.
Master’s Programs
5-Year Trends of Master's Programs Admissions
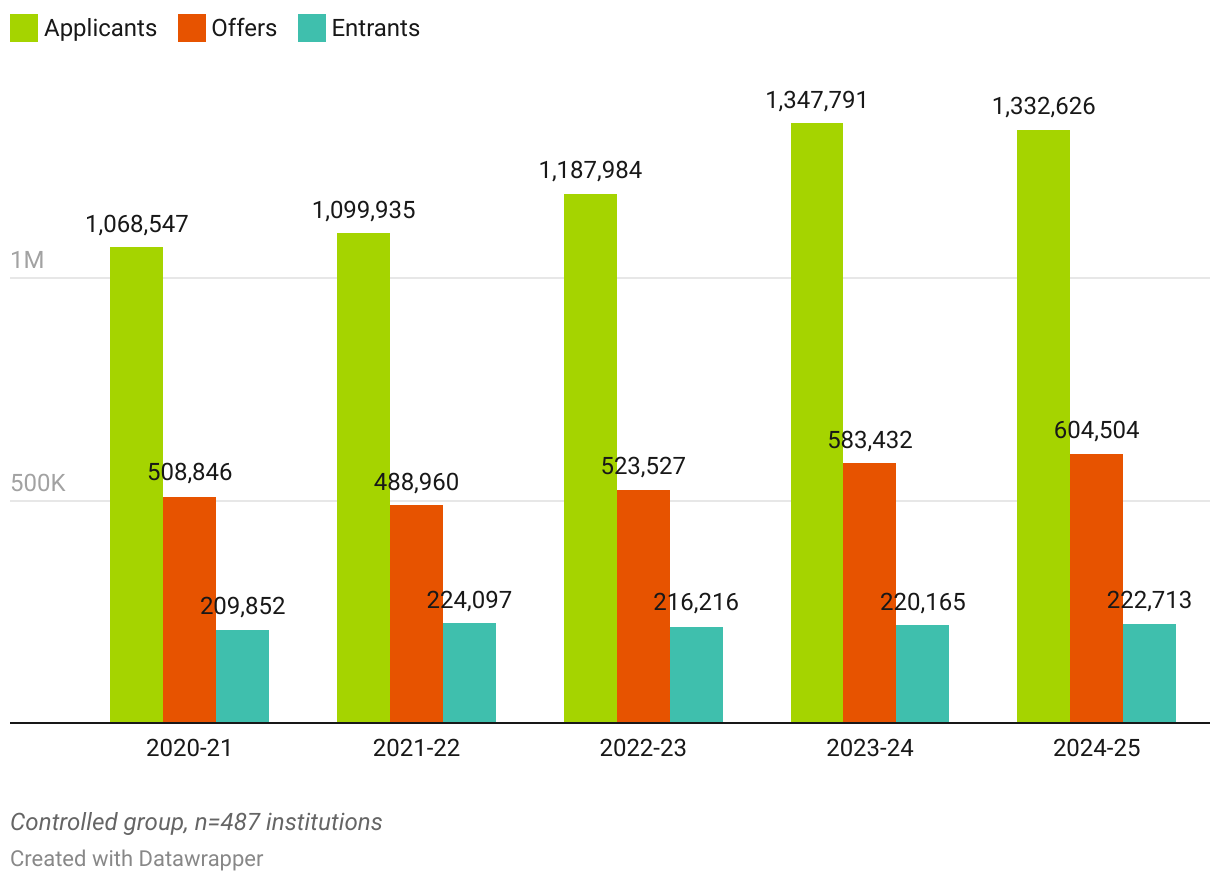
Master’s applications increased steadily over the five-year period, rising by 25 percent with an annual growth rate of about 6 percent. Offers follow a similar pattern, increasing by 19 percent overall—with a slight downturn in 2021–22—but a five-year annual growth rate of 5 percent.
Growth in new entrants is more limited. Entrants rose by 6 percent across the period and showed a brief decline in 2022–23, resulting in an annual growth rate of about 2 percent. The slower increase in entrants compared with applications and offers suggests that admitted students may be taking more time to decide or considering a wider mix of program options before enrolling.
Regional Trends: Master’s
Percentage of Total Master’s Applicants Across Regions
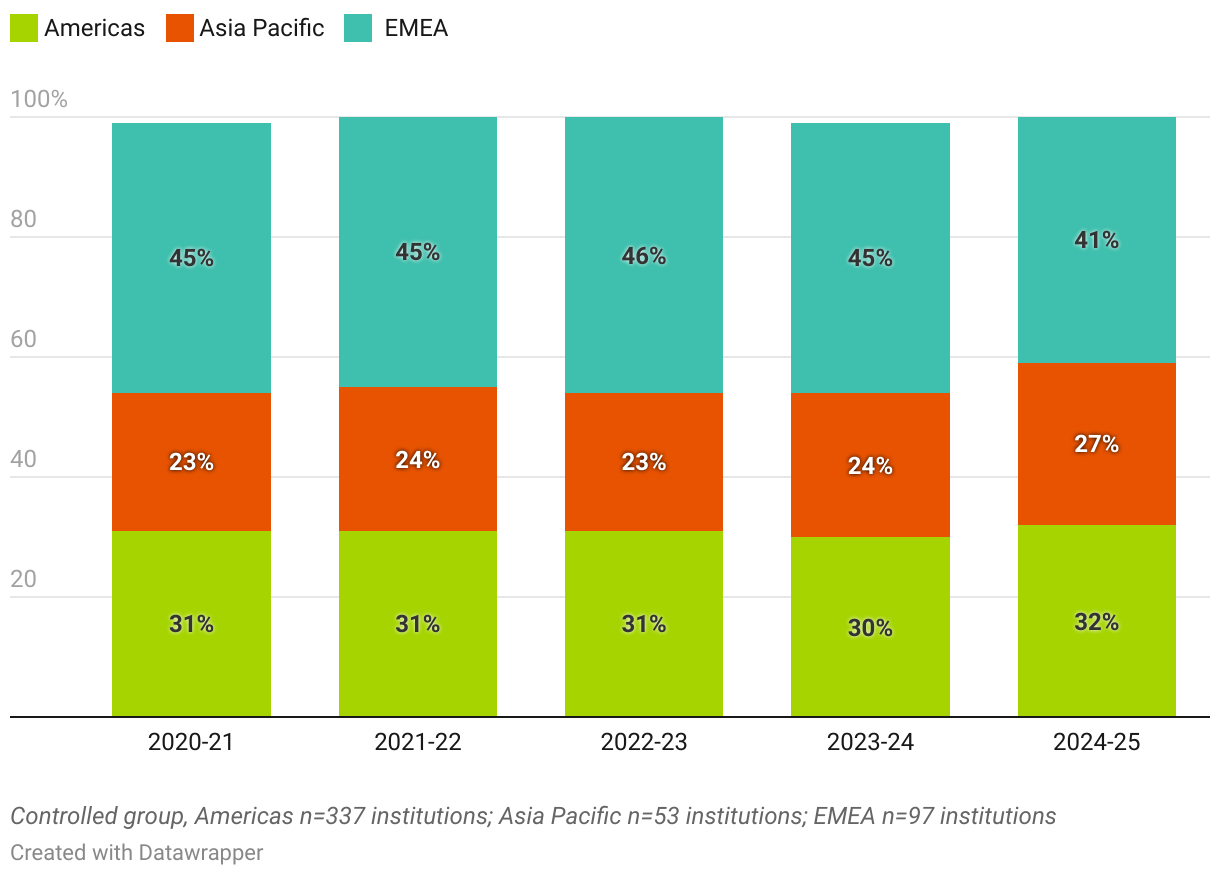
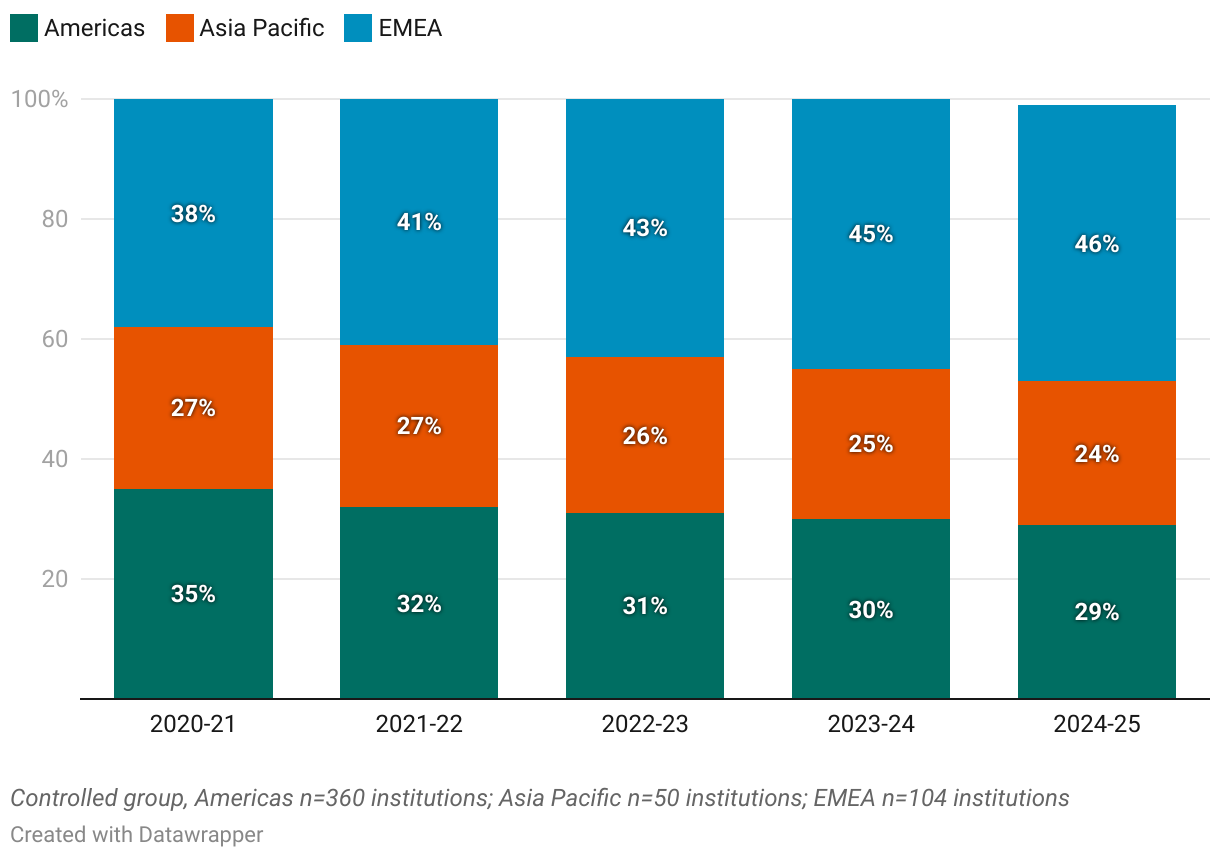
Total master’s applications are concentrated in EMEA, which accounts for nearly half of all applications across the five-year period—a notable finding given the smaller sample size of EMEA schools compared to the Americas. The Americas region maintains a stable share of applications with minimal variation. Asia Pacific, although having the smallest share, experiences a gradual increase and reaches its highest point of applicants in 2024–25.
Compared to undergraduate trends, regional distribution at the master’s level shows a more pronounced concentration in EMEA and a clearer upward shift in Asia Pacific, indicating different geographic patterns of interest across program levels.
Percentage of Master’s Applicants Across Program Type
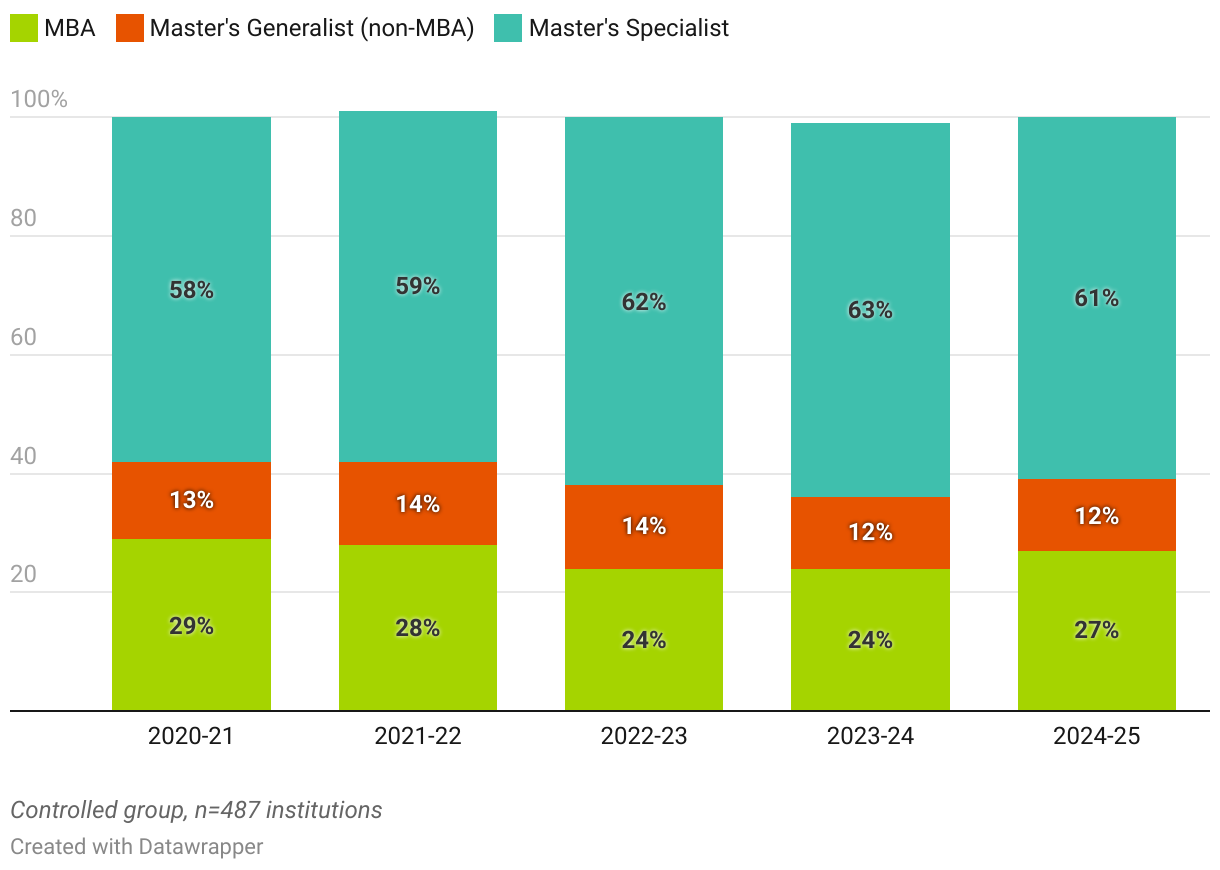
Master’s specialist programs consistently draw the largest share of applications, hovering around 60 percent over the five-year period. Their share remains stable, showing that interest in more focused degree paths has been a defining feature of the master’s market. MBA programs form the second-largest category and encounter a brief decline in the middle of the period before increasing in 2024–25. Master’s generalist programs, representing the smallest share, experience a slight decline over time.
These shifts highlight how applicants at the master’s level continued to gravitate toward programs with a more specific area of focus.
Admissions: Master’s
Overall, the conversion from interest to enrollment appears similar across all master’s programs compared to undergraduate programs; however, variations emerge at different program levels and on a regional basis.
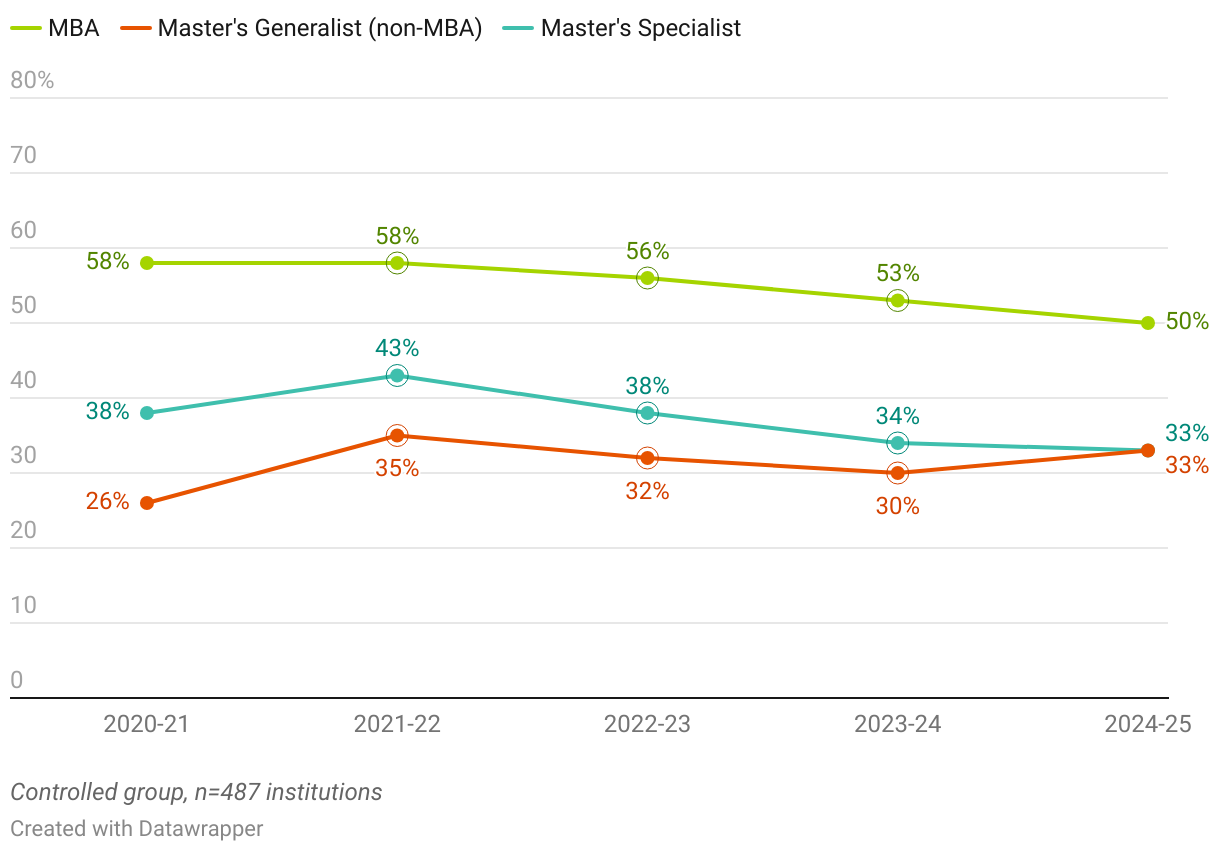
Acceptance Rates by Program Type
Master’s specialist programs display the highest acceptance rates for most of the five-year period, with a gradual decline through 2023–24 and an increase in 2024–25. Master’s generalist programs also show early declines and a later rise that remains below their initial level. MBA programs have the lowest acceptance rates and move steadily downward.
Overall, the data indicate that selectivity in undergraduate and master’s specialist programs is broadly comparable, while MBA programs remain the most selective of the three. This trend has become increasingly pronounced, with less than four in 10 MBA applicants receiving an offer on average.
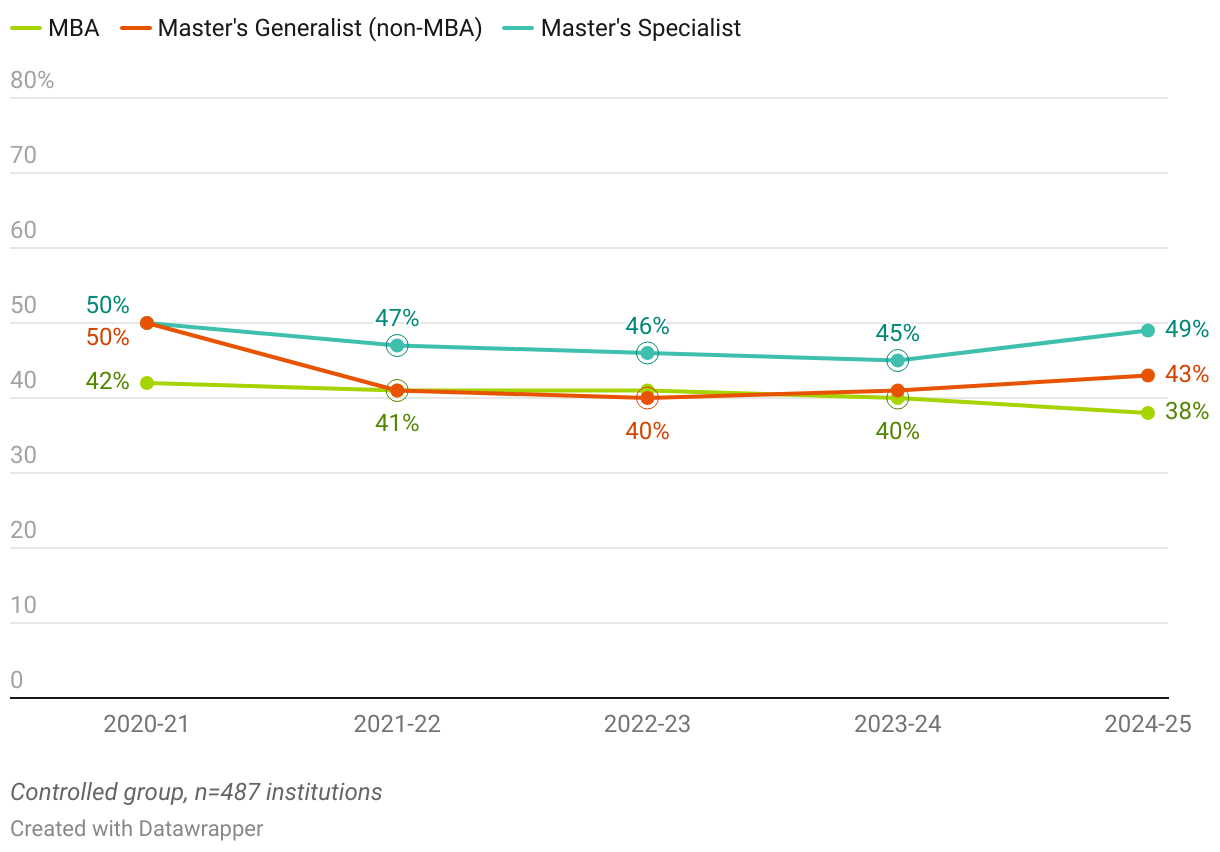
Admissions Yield by Program Type
Given that MBA programs are the most selective among master’s-level offerings, it is not surprising that they also maintain the highest admission yields over the five-year period. However, this yield has steadily declined and now reflects that only about half of admitted students ultimately enroll. Master’s specialist and generalist programs, while already yielding significantly lower conversion rates than the MBA, experience similar declines. This downward trend across all program types suggests growing uncertainty or hesitation among admitted students as they make their final enrollment decisions.
Total Master’s Acceptance Rate vs. Admissions Yield by Region
From a global perspective, acceptance rates and admissions yields for master’s programs have remained relatively steady over the five-year period. Notably, in 2021–22, the typical gap between these measures briefly inverts, with a higher share of admitted students enrolling than applicants being accepted. After that year, the gap widens in the opposite direction, signaling a gradual and continued decline in yields.
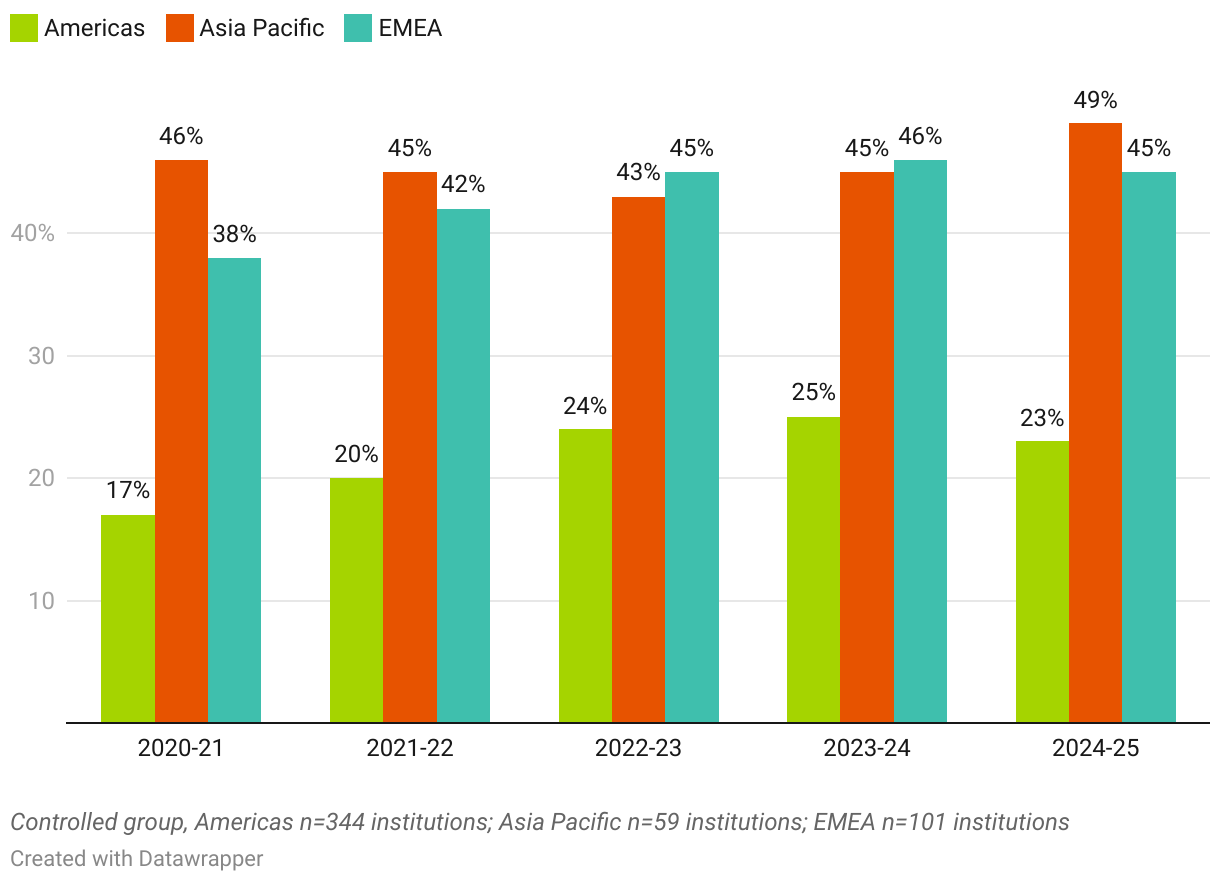
Regionally, the patterns mirror those observed at the undergraduate level, but with some distinct nuances. In the Americas, acceptance rates remained between 54 and 59 percent while admissions yields decline steadily from 49 to 43 percent, indicating that institutions are admitting more students but enrolling them in decreasing numbers.
EMEA reflects a similar pattern, although acceptance rates hover lower than those in the Americas, between 44 and 49 percent, and yields return to baseline levels at 32 percent after peaking at 39 percent in 2021–22. Across the three regions, EMEA consistently reports the lowest share of admitted students who ultimately enrolled.
Asia Pacific presents a contrasting profile. With the lowest acceptance rates, 27 to 30 percent, the region has maintained a more selective admissions environment, and unlike in the Americas and EMEA, its admissions yield has consistently exceeded its acceptance rate. Despite this distinct pattern, Asia Pacific’s yield has also declined over time. This slight downturn suggests that, although admitted students in the region are more likely to enroll relative to the number accepted, institutions there are still encountering increasing difficulty securing firm commitments from applicants.
Overall, these trends point to growing enrollment uncertainty across regions, with the widening gap between acceptance and enrollment most pronounced in the Americas and EMEA.
Enrollment Trends
While concerns about wavering enrollment are top of mind for higher education leaders in certain parts of the world, AACSB’s trend data suggest that, in aggregate, total enrollment across the AACSB business school landscape has not experienced a significant level of disruption.
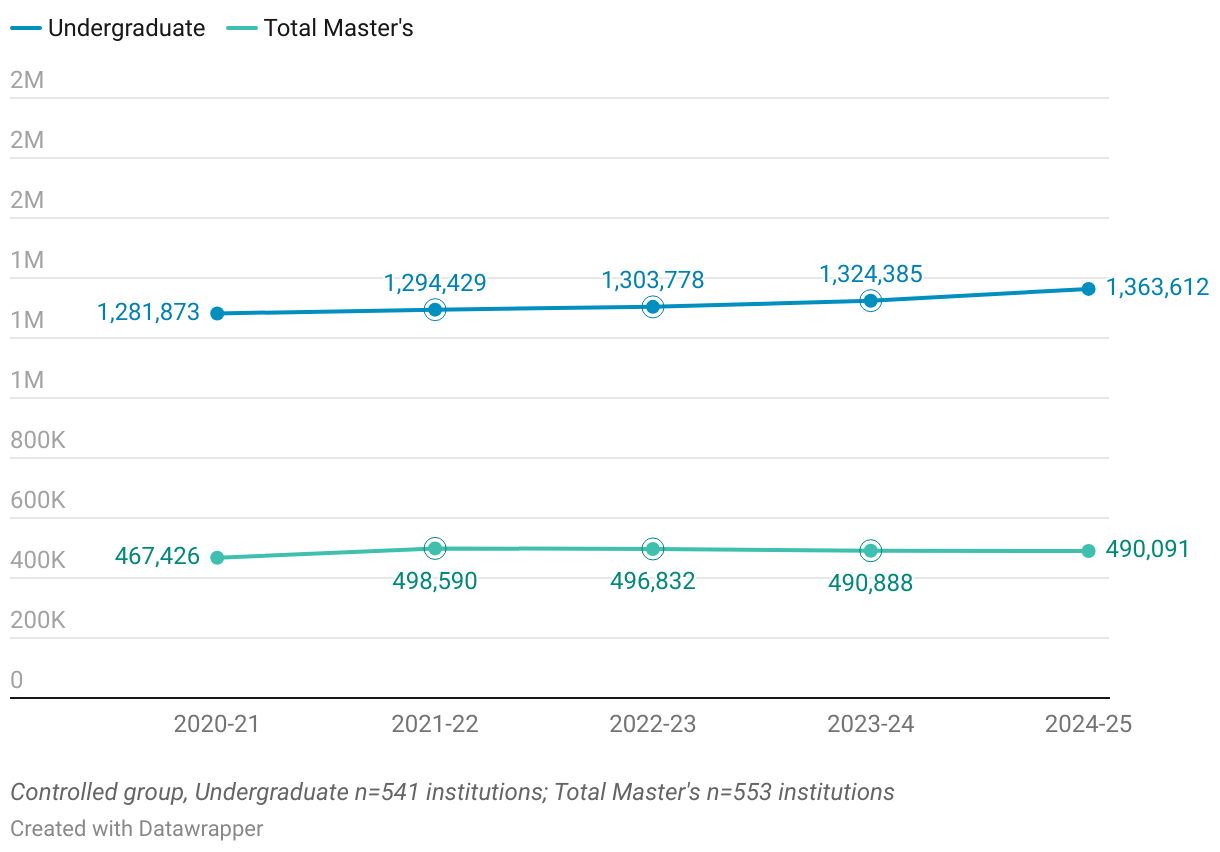
5-Year Trends of Undergraduate and Master's Enrollment
Undergraduate Programs
5-Year Trend of Undergraduate Enrollment by Region
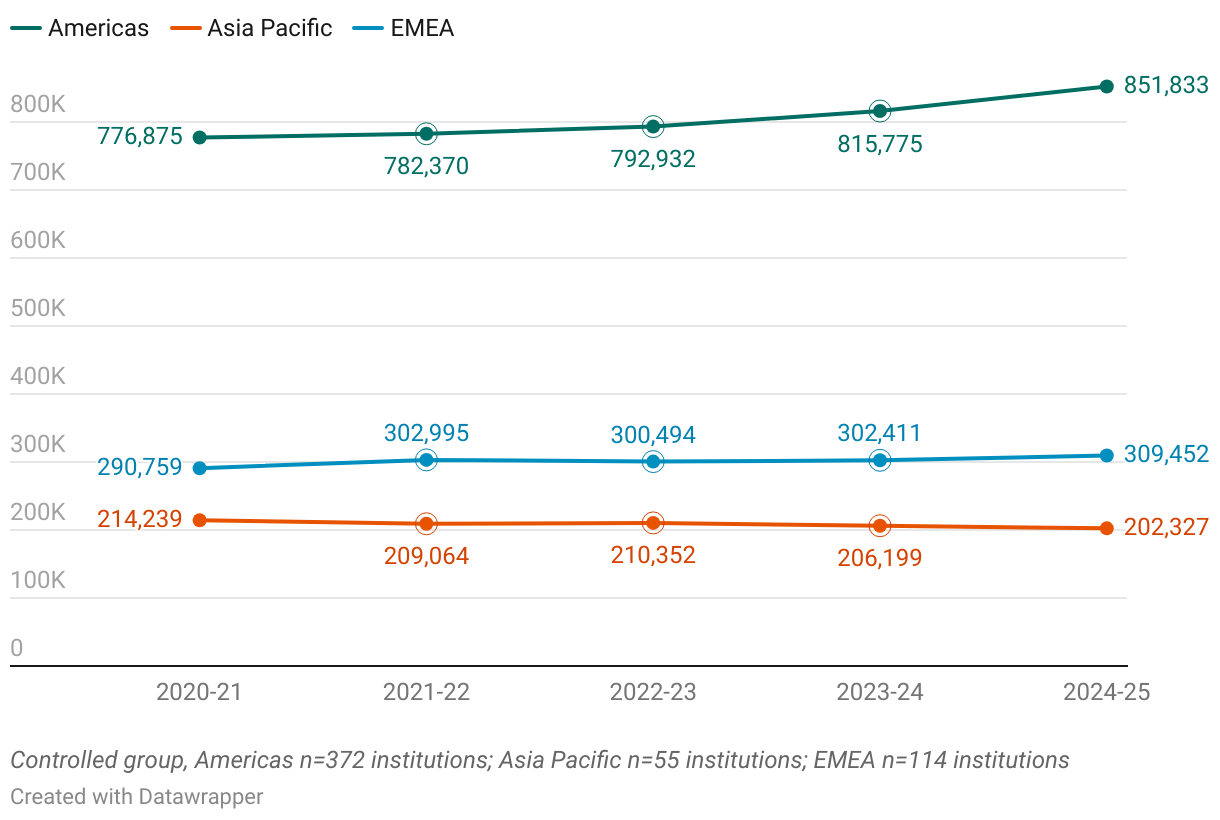
Keeping sample sizes in mind, undergraduate enrollment in the Americas is the largest of all regions and has increased steadily, rising by approximately 10 percent over the five-year period. Enrollment in EMEA has also grown—by about 6 percent—although at a slower annual pace, and its general scale remains significantly smaller than that of the Americas. In contrast, the Asia Pacific sample shows a consistent decline, resulting in an overall 6 percent decrease in undergraduate enrollment over the same five-year span.
Range of Undergraduate Enrollment Shifts
While the data above show an aggregate picture of the enrollment landscape, schools in the sample report variability in the types and extent of changes in their enrollment figures. The chart below shows the range of undergraduate enrollment changes reported by schools in the sample.
5-Year Range of Change in Undergraduate Enrollment Across Schools
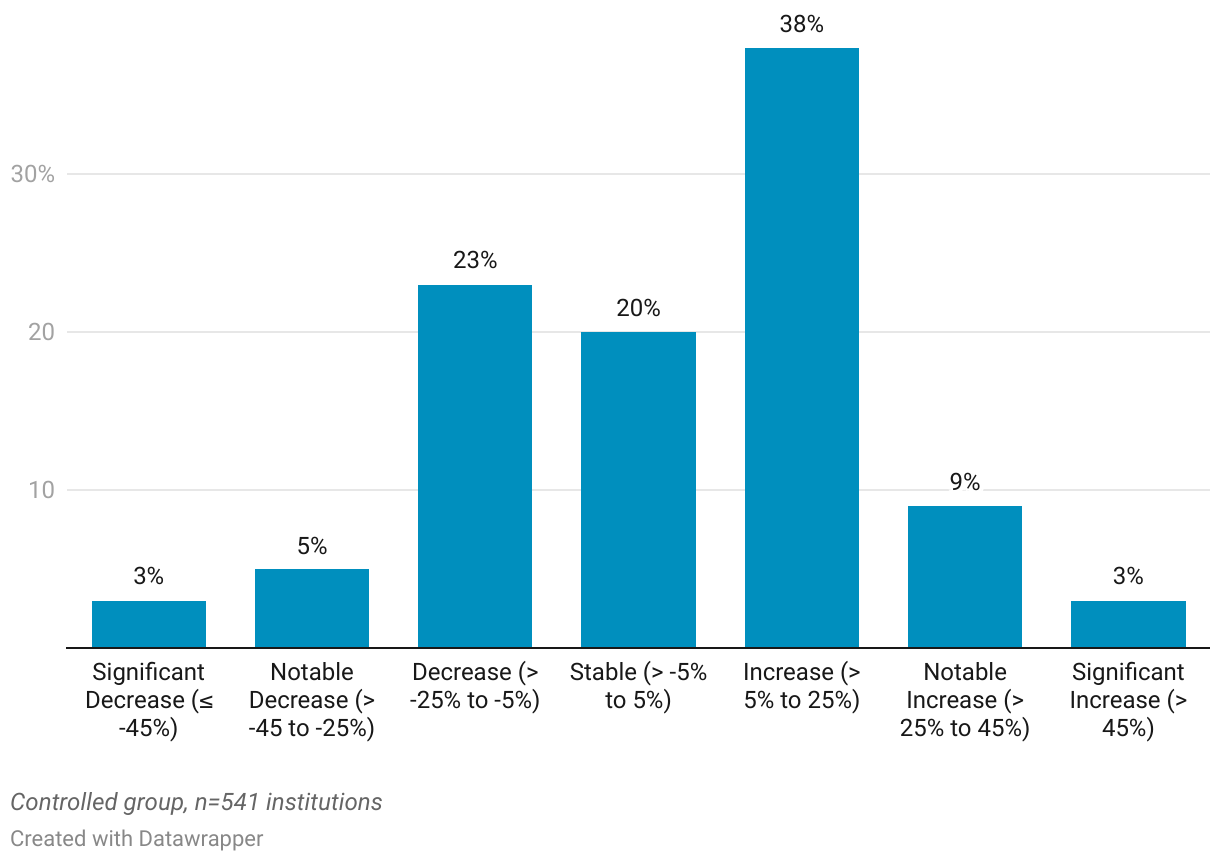
Across AACSB-accredited schools worldwide, 50 percent report growth (5 percent or more) in undergraduate enrollment over the five-year period, while 31 percent indicate declines and 20 percent convey little to no change. This distribution indicates that enrollment growth is more common than decline, but meaningful shifts, both upward and downward, are occurring across the undergraduate landscape.
Master’s Programs
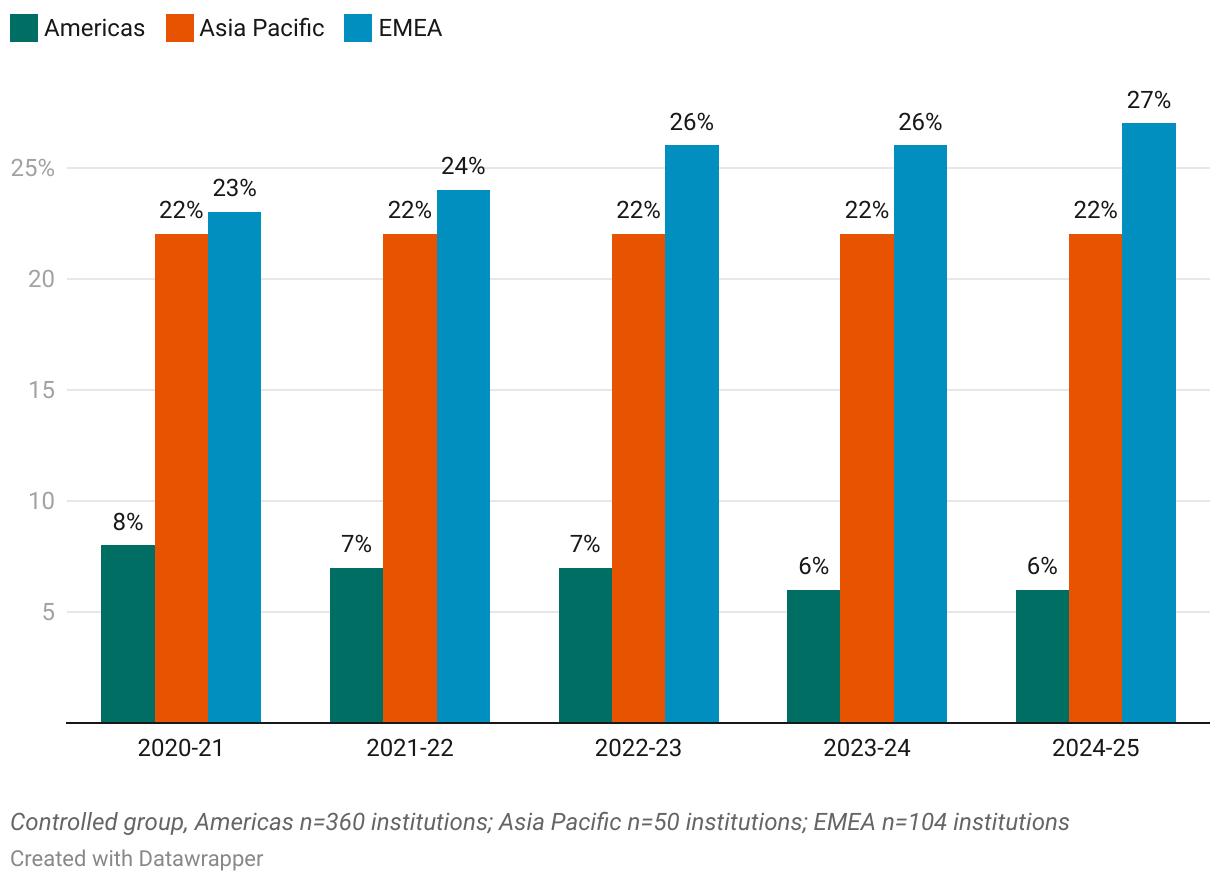
5-Year Trend of Master's Enrollment by Region
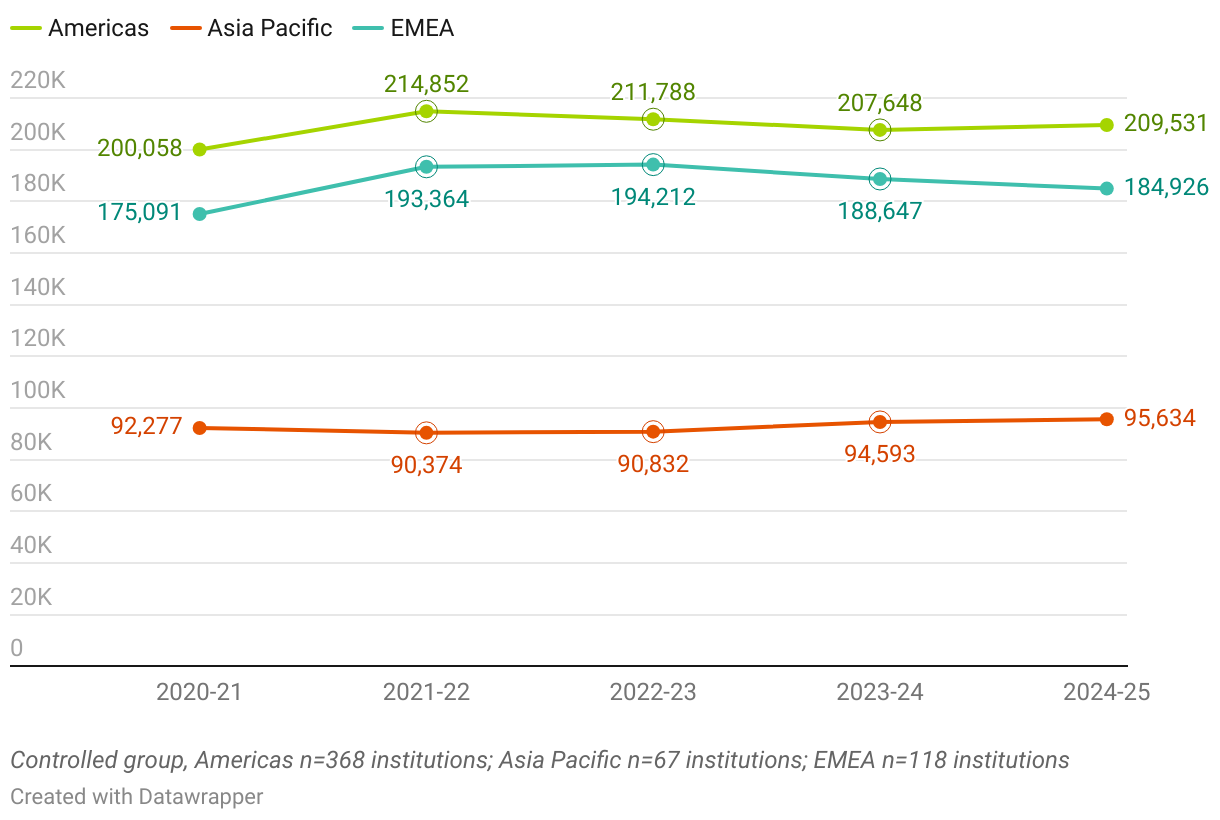
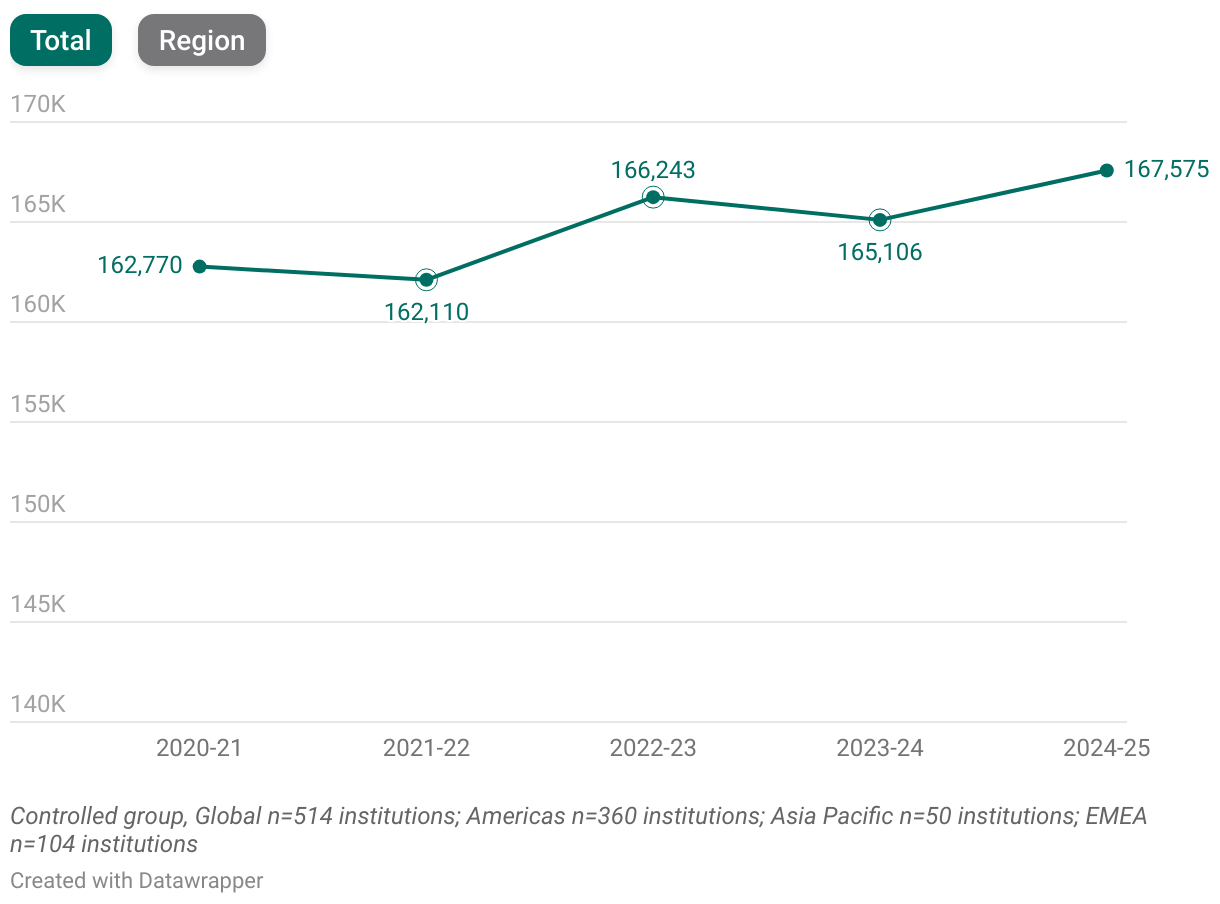
Master’s enrollment in the Americas is the largest among the three regions, with EMEA close behind—an especially notable finding given the differences in sample sizes. Although the EMEA sample is roughly one-third the size of the Americas sample, its institutions account for a substantial share of total master’s enrollment, a pattern not reflected at the undergraduate level. Across all three regions, five-year growth in master’s enrollment ranges from 4 percent in Asia Pacific to 6 percent in EMEA, indicating steady but modest expansion.
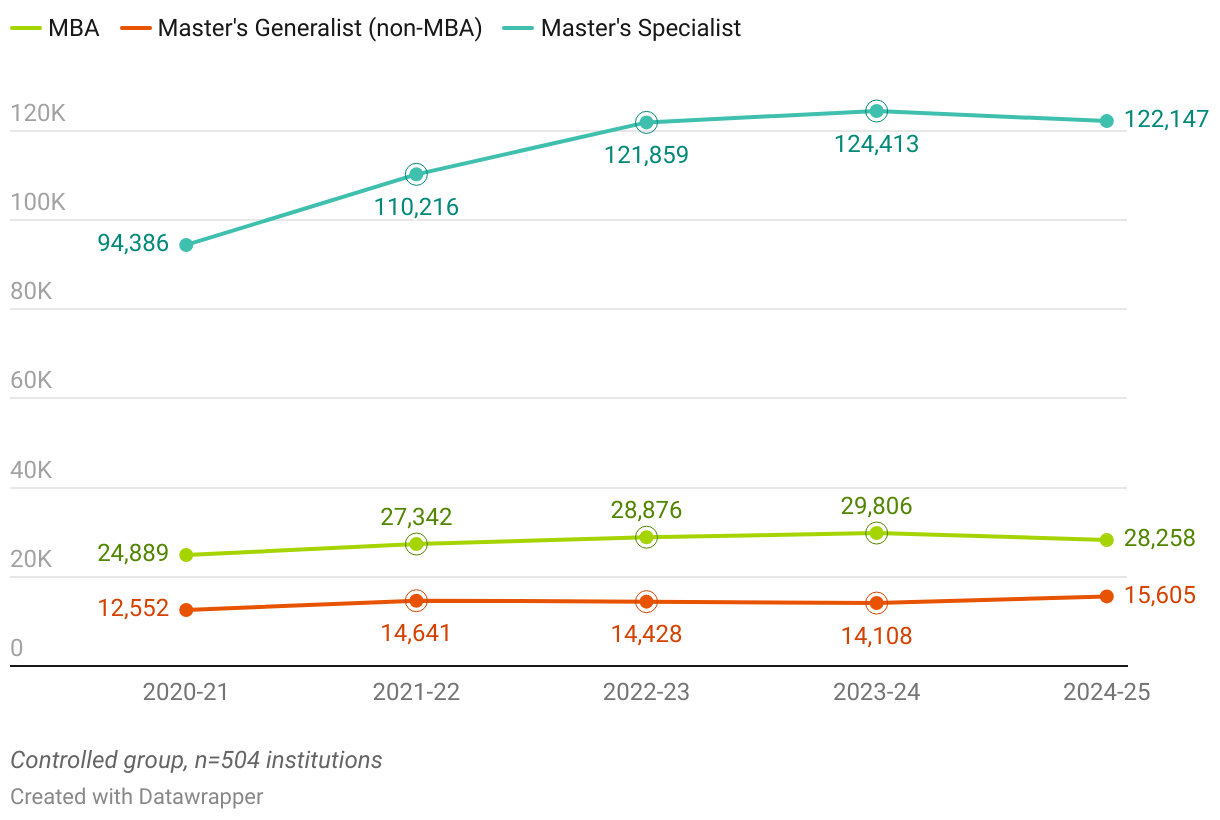
5-Year Trend of Master’s Enrollment by Program
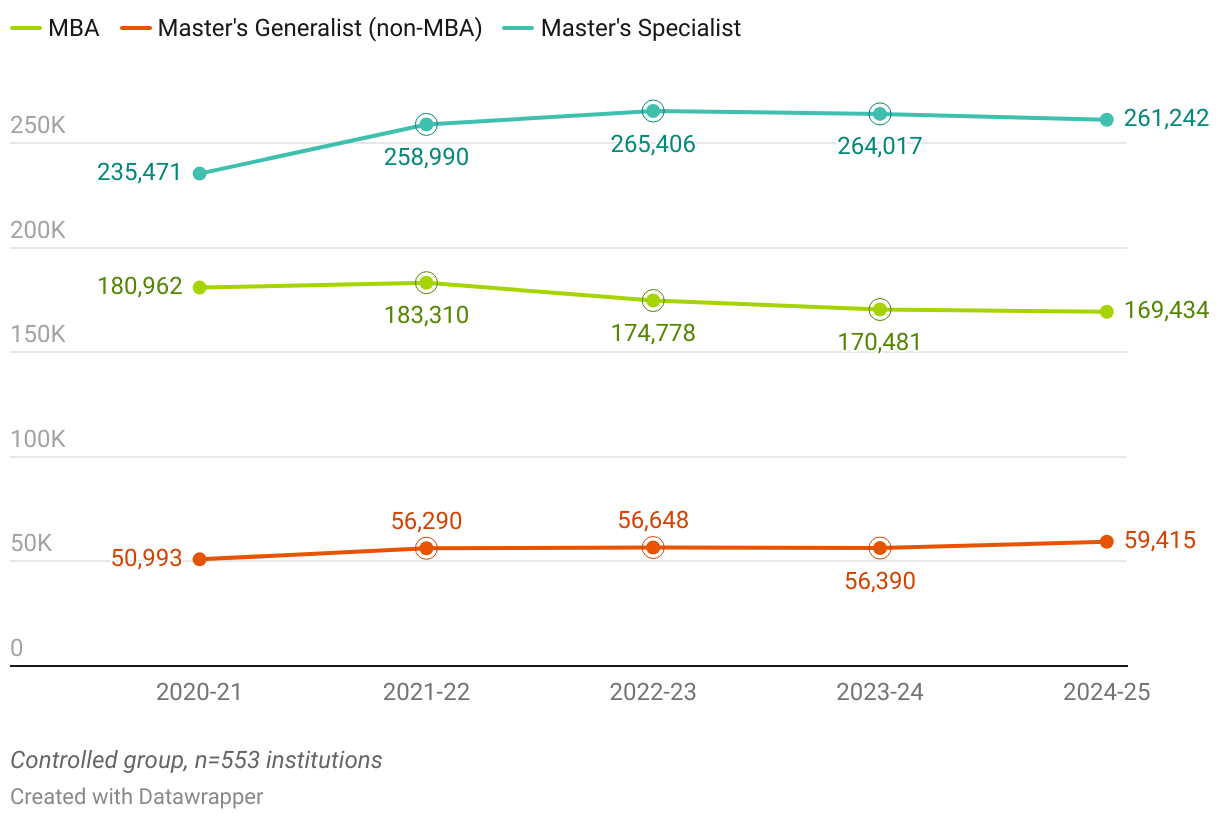
Among the three program types, the MBA is the only one to experience a five-year decline, falling by 6 percent. In contrast, enrollment in master’s specialist and generalist programs grew by 11 percent and 17 percent, respectively. However, specialist programs show a slight dip in 2024–25, a trend that will be important to monitor in future data collections.
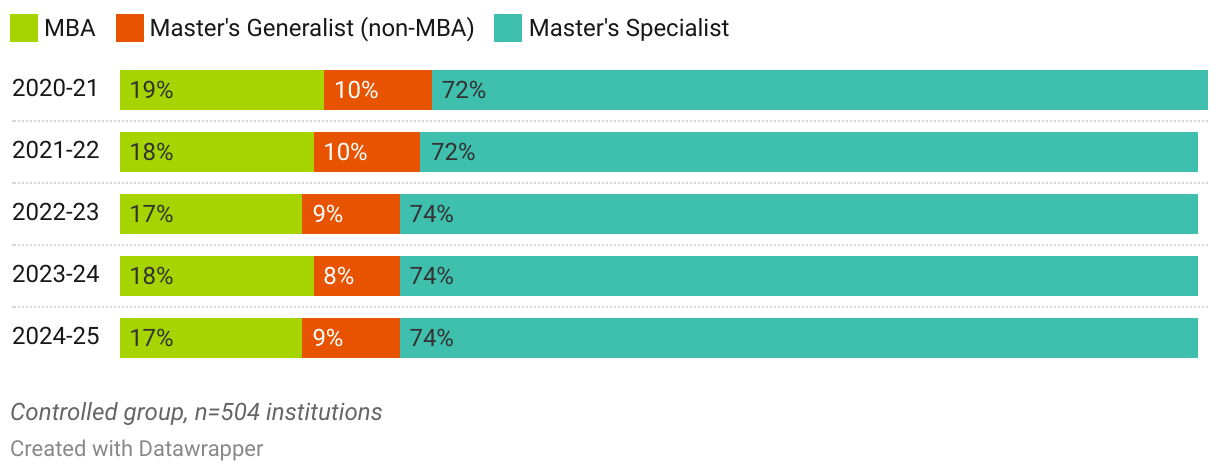
5-Year Trend of Percentage of Master’s Enrollment by Program, by Region
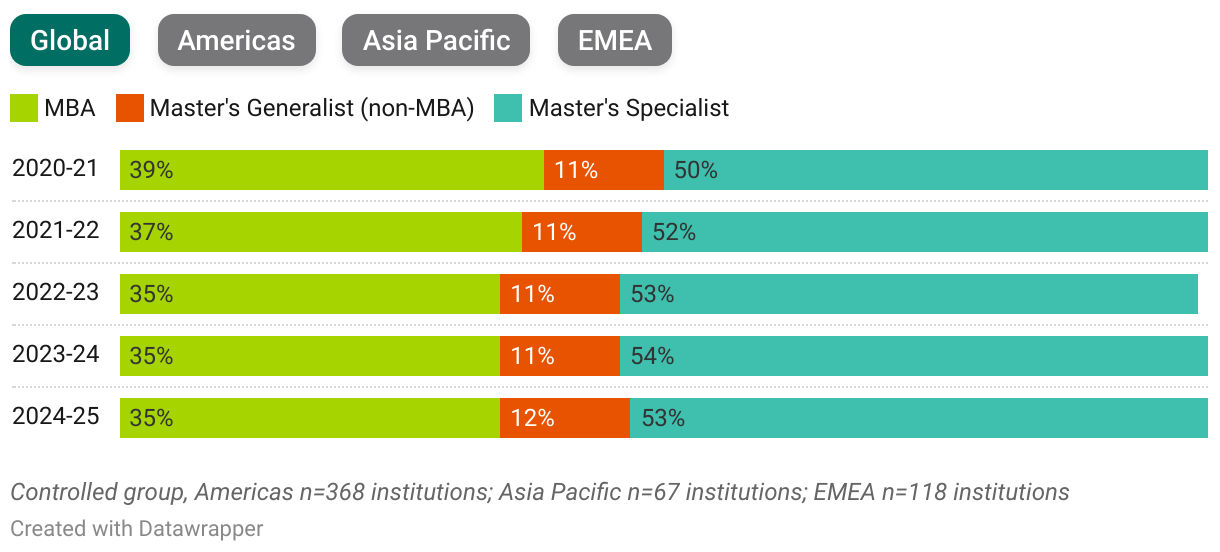
Master’s specialist programs hold the largest share of master’s enrollment throughout the five-year period, accounting for more than 53 percent in 2024–25. Regional patterns, however, show notable variation:
- Americas: On average, 59 percent of master’s enrollment is concentrated in MBA programs.
- Asia Pacific and EMEA: Specialist programs are the dominant segment in these regions, representing an average of 54 percent and 66 percent of master’s enrollment, respectively.
- EMEA: The region shows considerably lower MBA enrollment and significantly higher generalist enrollment compared to the other regions, reflecting a greater prevalence of generalist program models in EMEA.
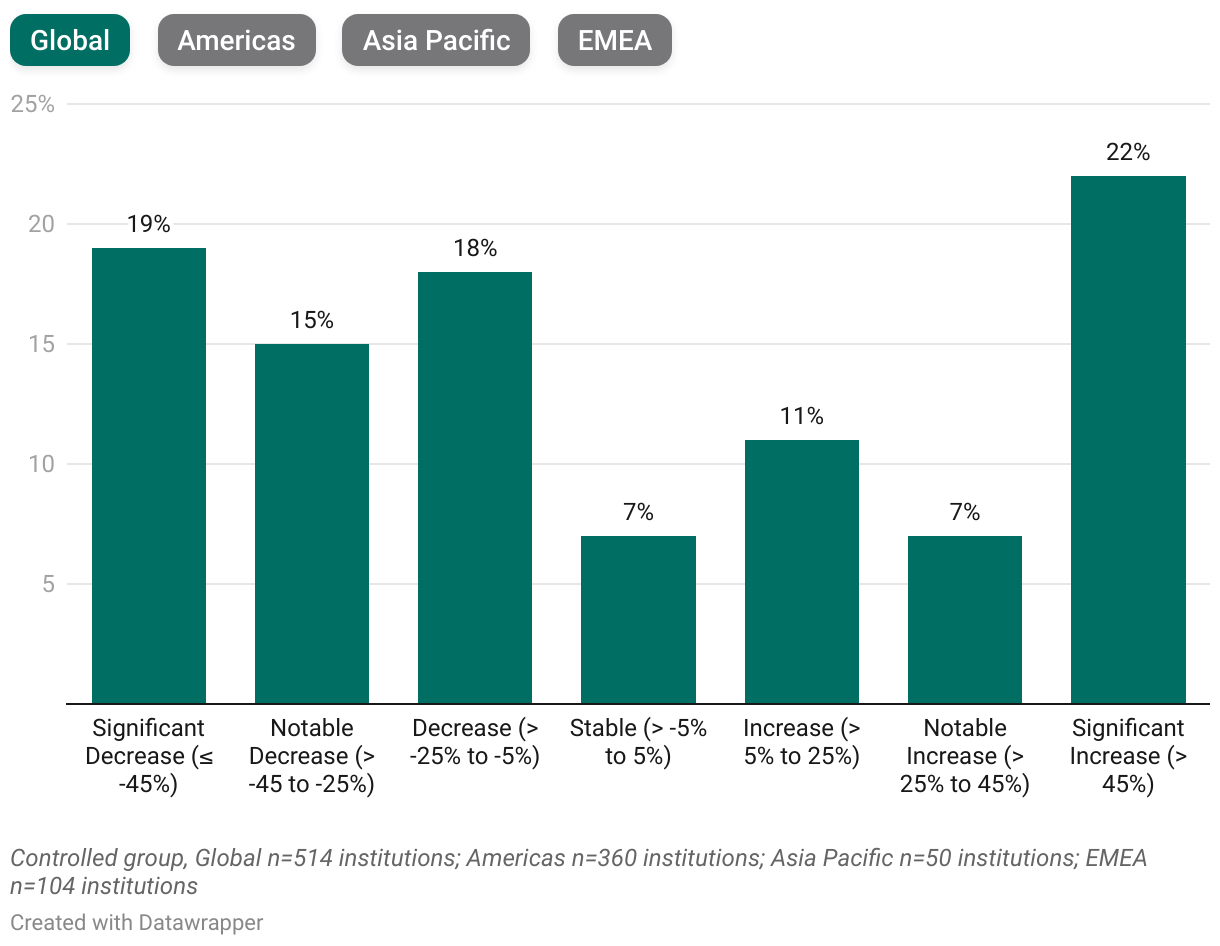
5-Year Range of Change in Master’s Enrollment Across Schools
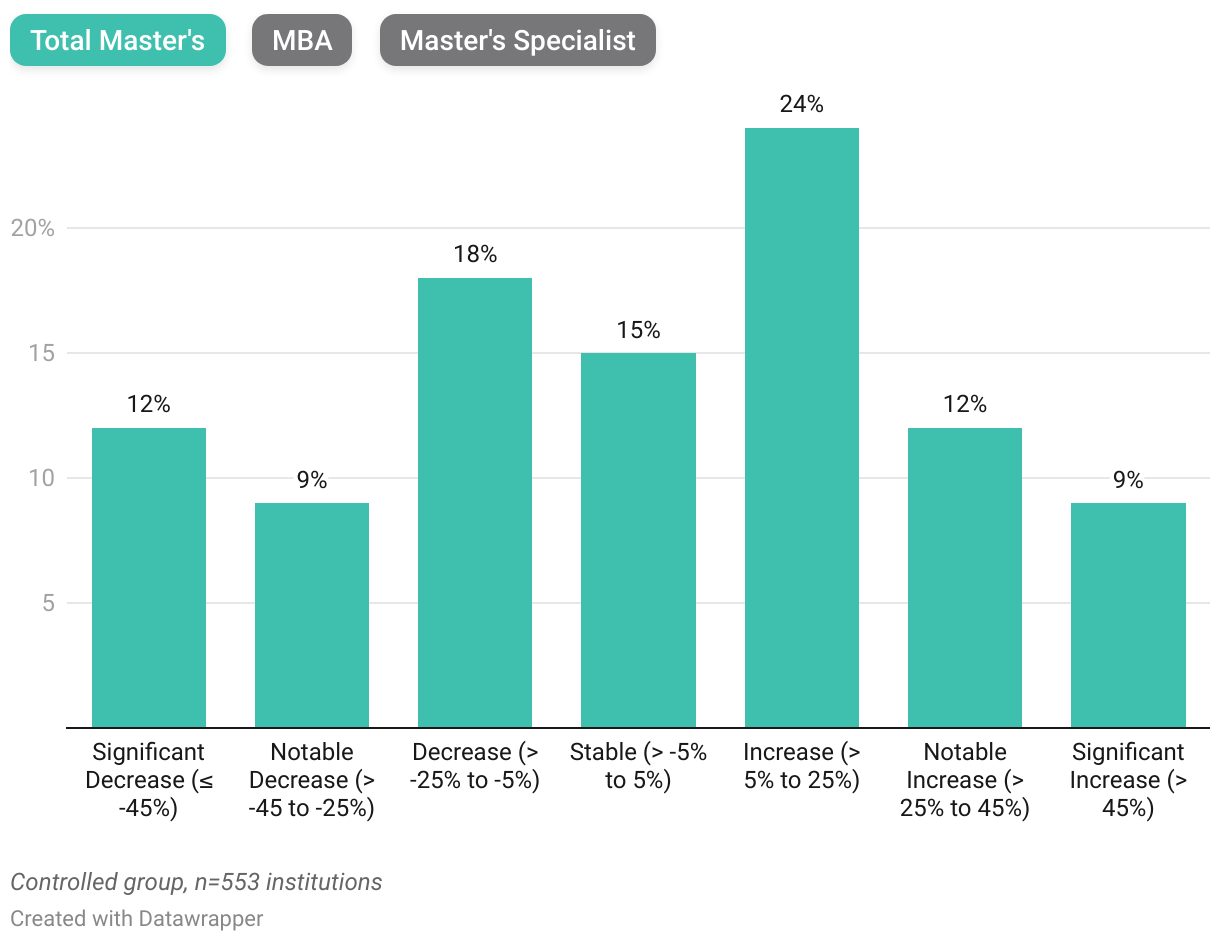
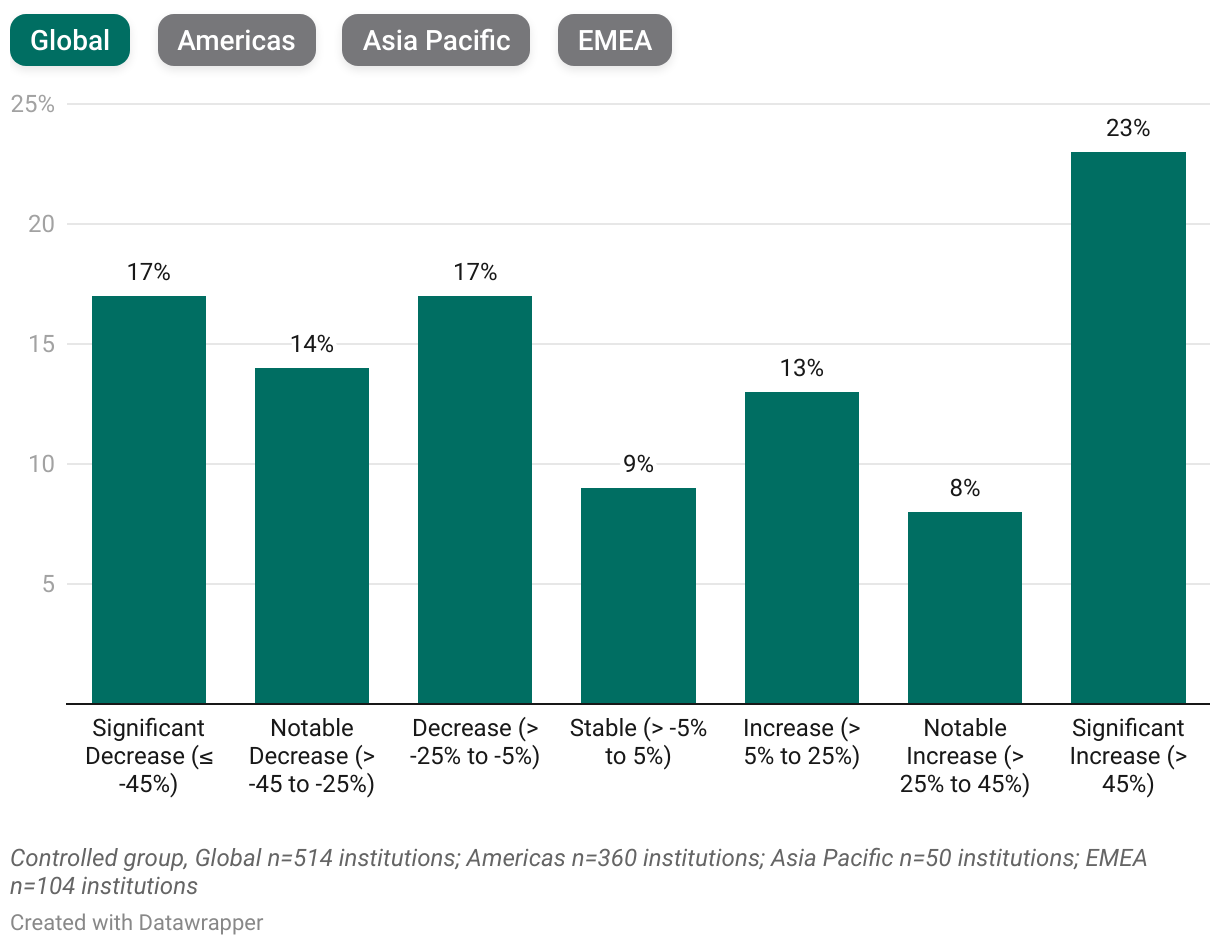
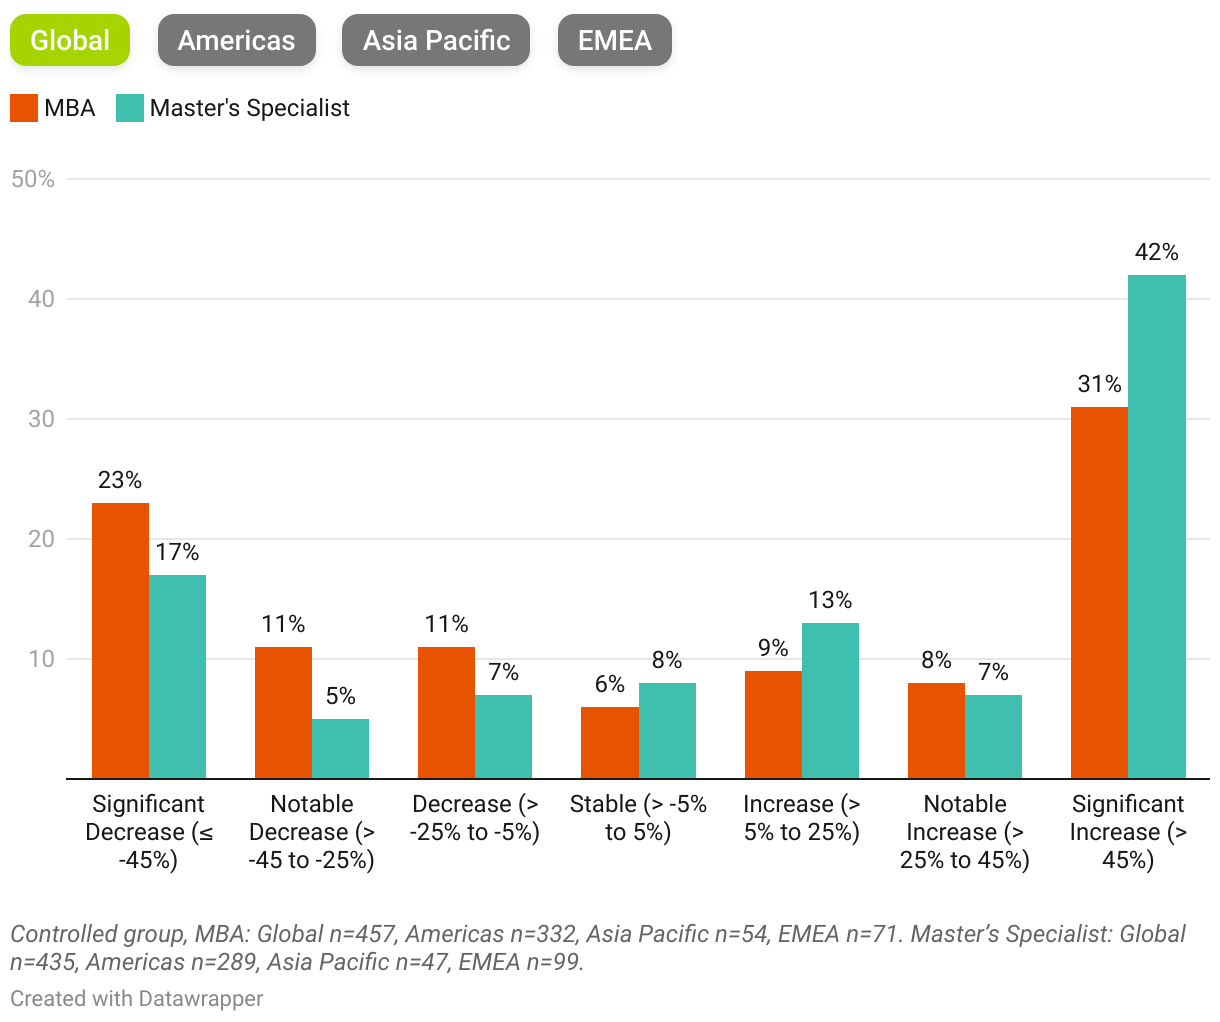
Total master’s enrollment changes are more varied than undergraduate enrollment shifts over the five-year period, with notable differences between master’s specialist and MBA programs. Overall, 45 percent of schools report increases in their master’s enrollment, compared to 39 percent that note declines.
MBA programs, however, present a more challenging picture: half of the schools offering MBAs report a five-year decline in MBA enrollment, with 19 percent indicating a decrease of more than 45 percent. In contrast, 57 percent of schools with master’s specialist programs report enrollment growth, with nearly one-quarter noting increases between 5 and 25 percent.
Distribution of Master’s Enrollment Sizes Across Schools
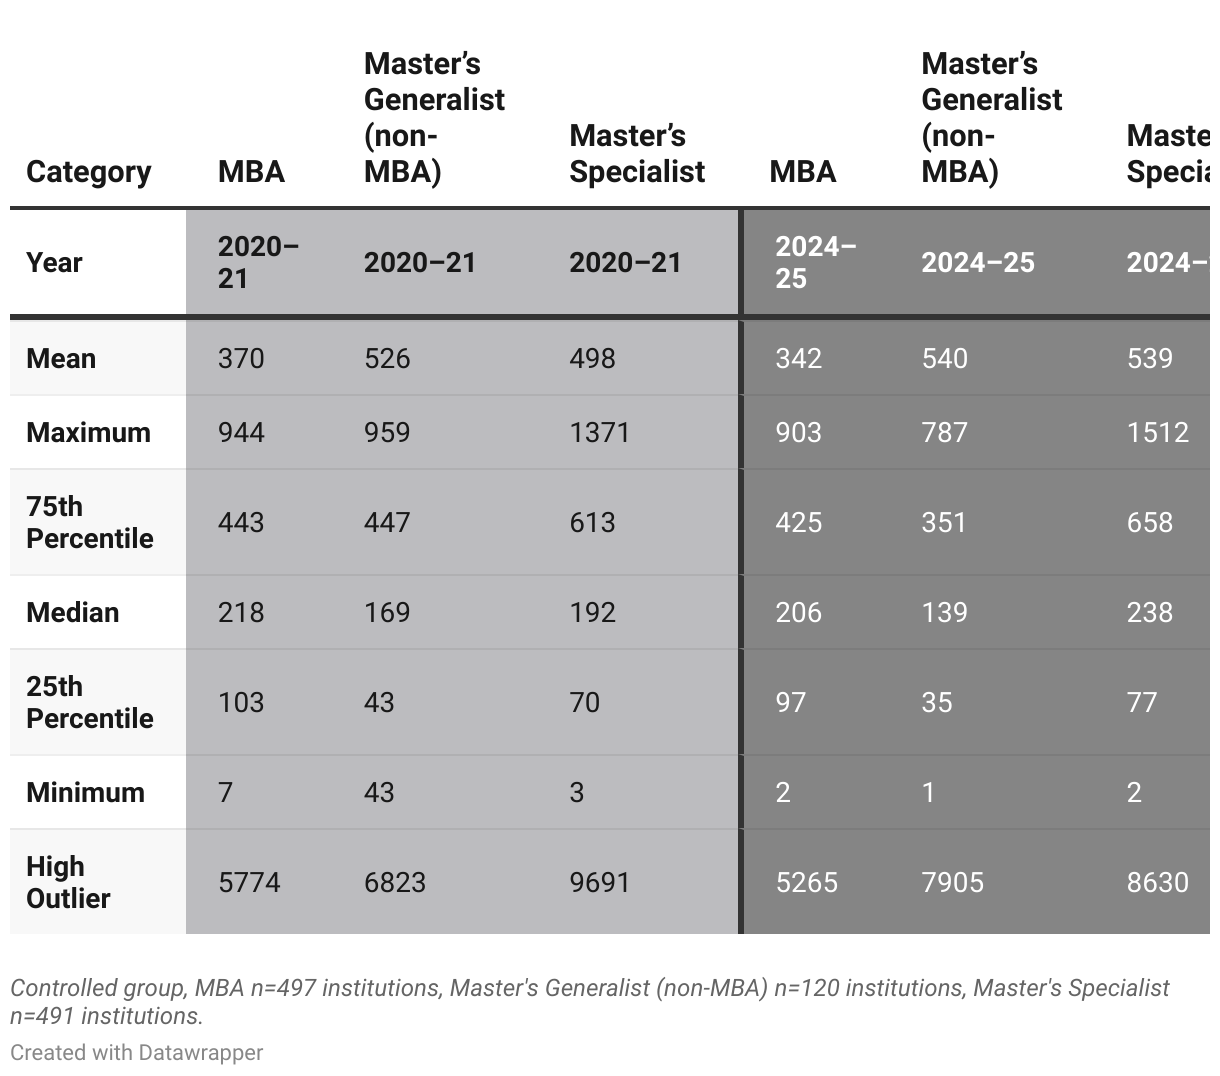
Given the diversity of schools in the sample, not only by region but also by size and institutional context, we provide an additional view to illustrate the distribution, spread, and outliers within the master’s enrollment landscape over a five-year period. The box-and-whisker plot below shows each school in the sample as an individual dot, representing its total enrollment at each master’s program level.
Distribution of Enrollment by Education Level: 2020–21 vs. 2024–25
Key Takeaways
- While the middle of the distribution remains relatively stable, enrollment distributions remain highly skewed, driven by a small number of exceptionally large programs. This is especially evident among specialist programs, where one school enrolled nearly 10,000 students in 2020–21.
- MBA enrollments show a slight softening over the five-year period, with modest declines in both mean and median values.
- Generalist (non-MBA) programs display a polarized enrollment pattern: while most programs are enrolling fewer students, a small number of very large programs continue to grow. This polarization may be influenced by the concentration of these programs in the EMEA region, which accounts for an average of 75 percent of all generalist enrollment.
- Specialist programs demonstrate the strongest growth, with increases in both mean and median enrollment and a wider spread across institutions.
Distribution of Enrollment by Program Level: 2020-21 vs. 2024–25 (Detailed Statistics)
Demographics and International Mobility
This section examines two key dimensions of business school enrollment: gender representation and international student presence and impacts. International mobility has become a closely watched indicator as institutions aim to understand emerging shifts in global student flows. The analysis below offers a deeper examination of current demographic patterns, highlights notable changes across regions and programs, and summarizes recent developments that are shaping the present environment.
Gender Representation Trends
Undergraduate Programs
5-Year Trend of Female Representation in Undergraduate Enrollment
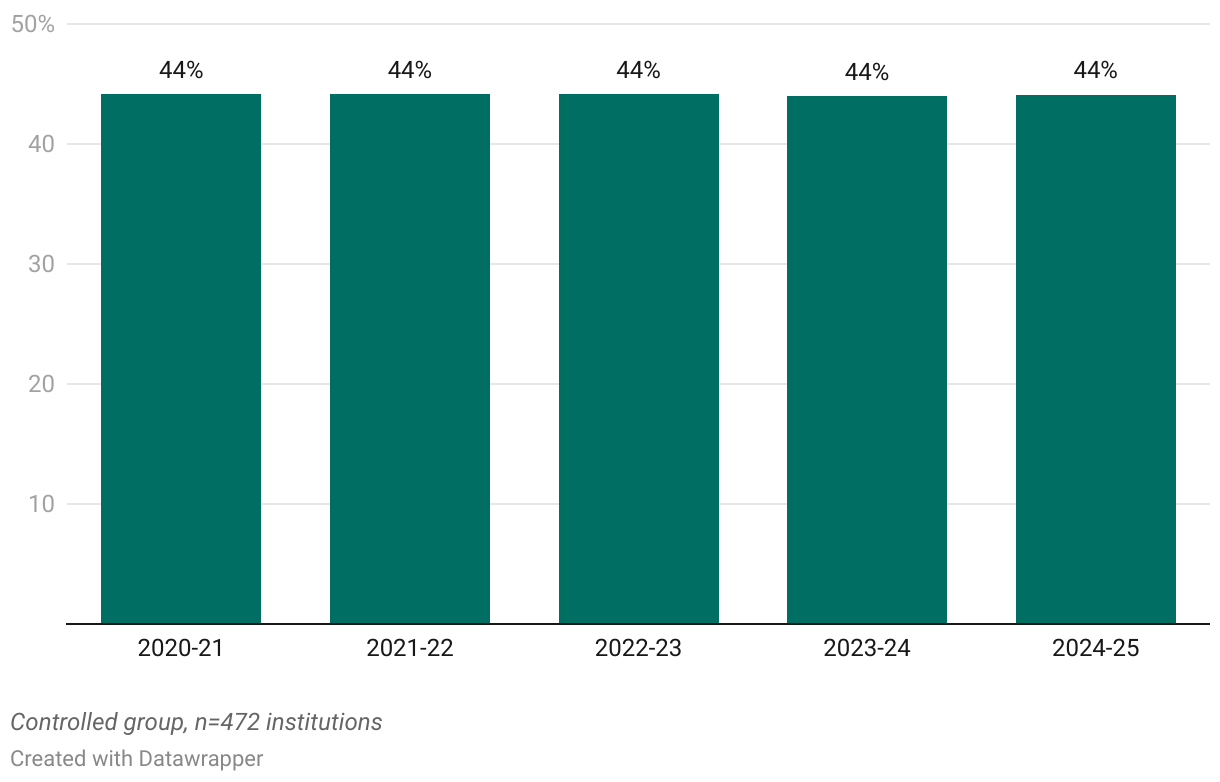
Female representation in undergraduate enrollment has remained unchanged at 44 percent throughout the five-year period.
5-Year Trend in Undergraduate Gender Distribution
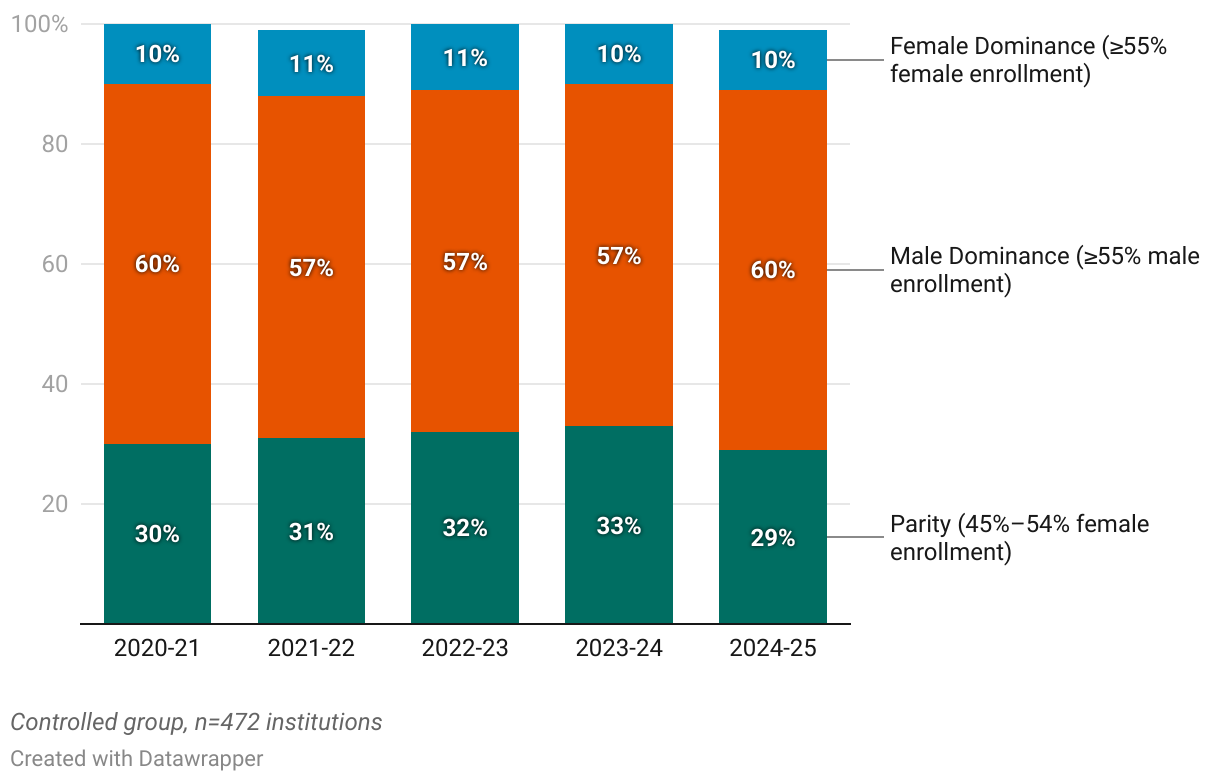
In addition to examining aggregate female-to-male enrollment ratios, we also look at the distribution of gender representation across undergraduate programs—specifically the share of programs with majority male enrollment, majority female enrollment, or gender parity. For this analysis, parity is defined as programs with female enrollment ranging from 45 to 54 percent of total enrollment.
The gender distribution across undergraduate programs shows negligible change over the five-year period. Sixty percent of schools report male-dominated undergraduate enrollment, while roughly 30 percent report gender parity. Only a small share of programs enroll a majority of female students.
Master’s Programs
At the master’s level, we examine the same trends, including differences between MBA and specialist programs.
5-Year Trend of Female Representation in Master’s Enrollment Across Program Levels
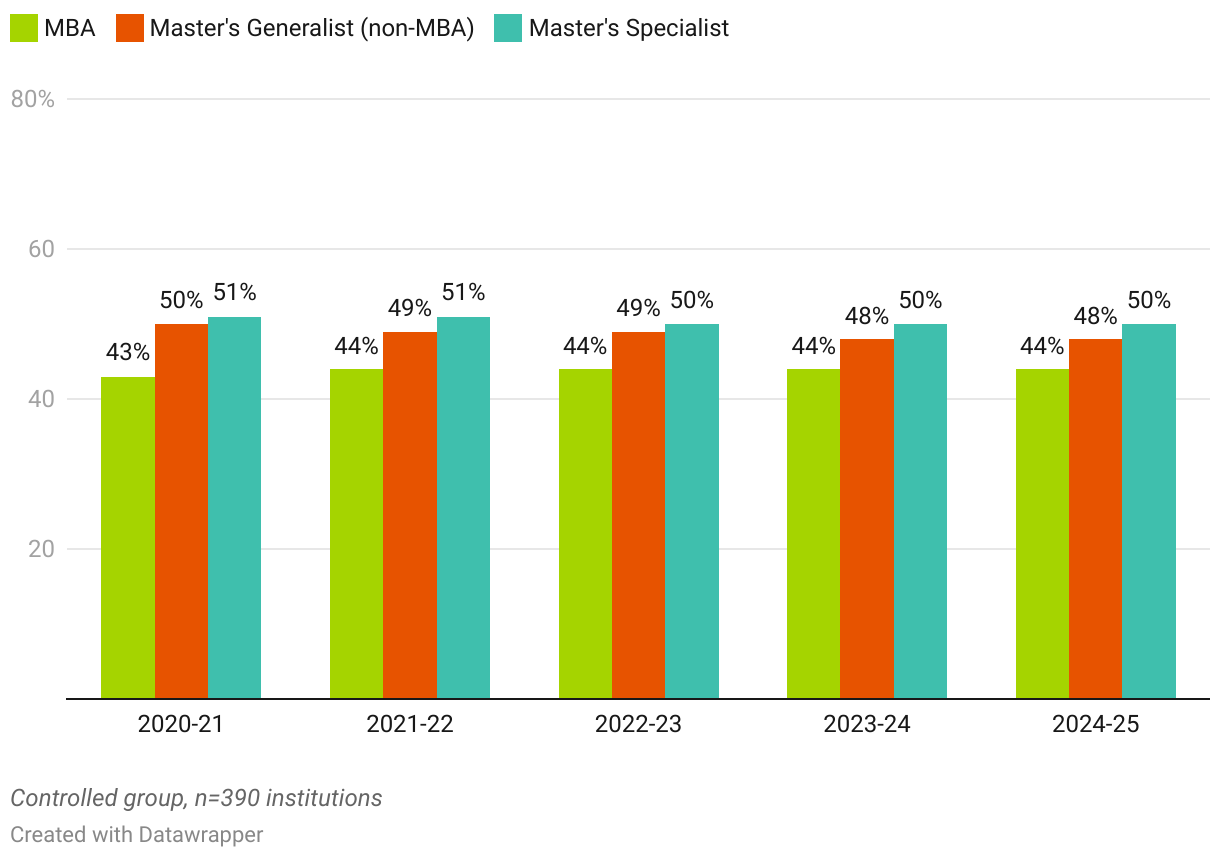
Similar to undergraduate trends, the aggregate female representation across master’s-level programs has remained unchanged over the past five years.
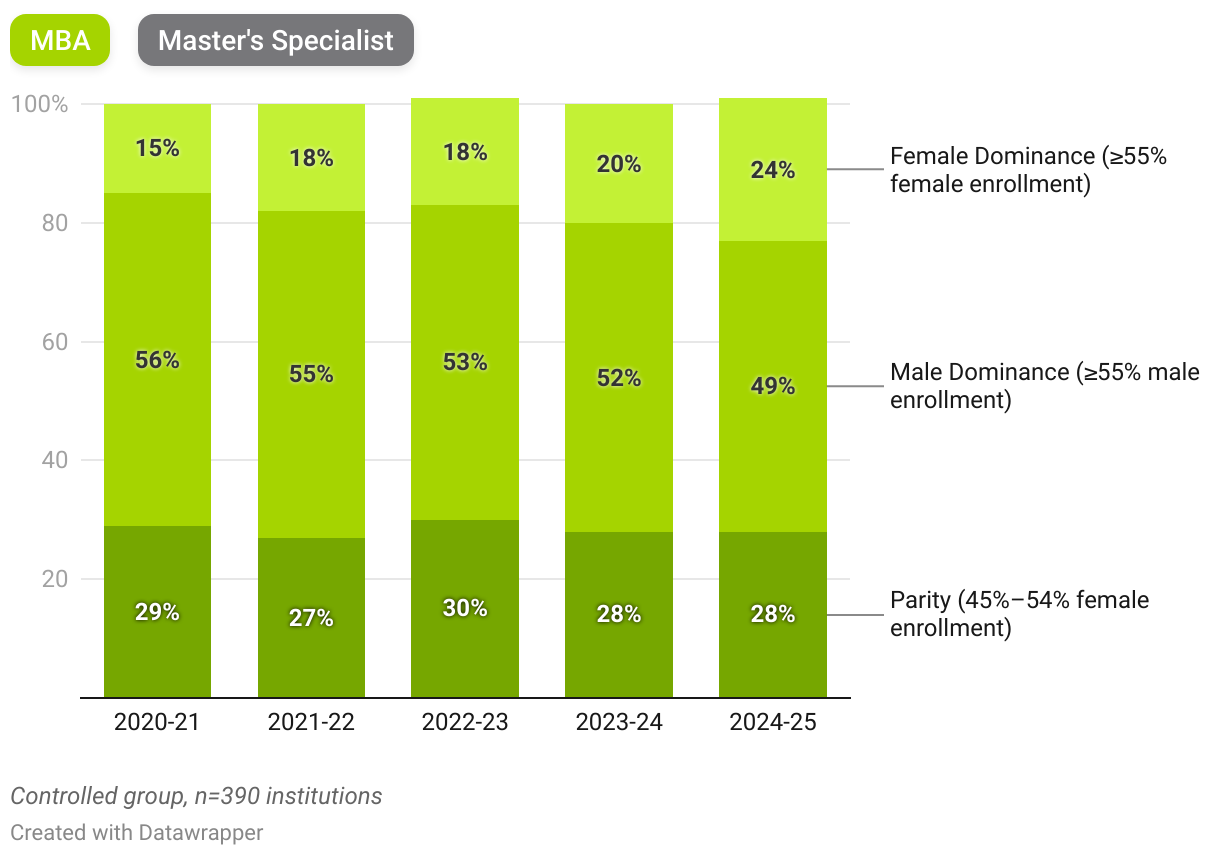
5-Year Trend in Gender Distribution: MBA vs. Master's Specialist
When comparing gender distribution between MBA and master’s specialist programs, a few notable patterns emerge. About half of MBA programs are male-dominated; however, that proportion has been gradually declining over time. Master’s specialist programs show a different profile, with nearly 40 percent enrolling more female than male students. MBA programs, by contrast, are more likely to achieve gender parity, with nearly 30 percent reporting an equal balance of male and female representation in the classroom.
International Student Trends
International student mobility is a priority topic across global higher education, extending well beyond the business school context. The following section presents five-year trends in international student enrollment from 2020–21 to 2024–25, along with findings from a fall 2025 survey that AACSB conducted among its member schools.
Overall, we observe a wide variation in international enrollment patterns over five years, both globally and within each region. Schools are experiencing different trajectories, which reinforces the complexity of international student mobility and its uneven impact across institutions.
Undergraduate Programs
Changes in International Student Volume
The total number of international students enrolled in business undergraduate programs worldwide has increased modestly over the past five years, by approximately 3 percent. Regionally, this increase is primarily driven by growth in the EMEA region, where international undergraduate enrollment has risen by 25 percent during the same period. In contrast, schools in the Americas and Asia Pacific have experienced steady declines.
5-Year Trend in International Undergraduate Enrollment Counts: Total and by Region
As illustrated in the chart below, in 2024– 25, nearly half (46 percent) of all international undergraduate students in this controlled sample are concentrated in EMEA institutions.
5-Year Trend in Concentration of International Undergraduate Students Across Regions
When examining the changes to international undergraduate enrollment counts over the five-year period globally, business schools are almost split in change trajectories: 44 percent experienced growth, 48 percent saw a decline, and 9 percent remained stable. However, regional patterns vary. In EMEA, a majority of schools (63 percent) report increases in international enrollment over the five-year period, compared to 40 percent of schools in the Americas and 37 percent in Asia Pacific, which also report growth.
5-Year Range of Change in International Undergraduate Enrollment Counts
Changes in Share of International Students
Despite shifts in individual schools’ enrollment volumes, the overall share of international undergraduate students globally remains steady, at roughly 13 percent. Yet this stability masks substantial regional variations. Schools in Asia Pacific and EMEA consistently report far higher proportions of international students in their undergraduate populations than schools in the Americas.
Percentage of International Undergraduate Students by Region
Looking beyond counts and examining the five-year change in schools’ share of international students, as a portion of the whole student population, allows us to understand whether the student body composition has shifted. As shown in the analysis, more than half of schools experience a decline in their international student share over the five years, while 40 percent report an increase.
5-Year Range of Change in Percentage of International Undergraduate Enrollment
In EMEA, where a strong majority of schools report growth in international enrollment counts, the picture becomes more nuanced when looking at proportions: 49 percent of schools report an increase in their international student share. Yet, among those that show an increase, 26 percent report growth of 45 percent or more, indicating substantial gains at a subset of institutions.
In contrast, a clear majority of schools in Asia Pacific and the Americas experience declines in their international student share. Still, variation within each region is significant. For example, while 38 percent of schools in the Americas report increases in their international student share, 21 percent of those increases are 45 percent or more—a notable level of growth for that subset.
Master’s Programs
Changes in International Student Volume Across Regions and Program Types
Overall, international students represent 36 percent of all enrolled master’s students, up from 30 percent five years prior. International enrollment at the master’s level has increased more substantially than at the undergraduate level, rising by 25 percent over the past five years across all programs.
5-Year Trend in International Master’s Enrollment Counts by Program Type
This growth is driven largely by master’s specialist programs, reflecting the broader enrollment patterns observed across the three master’s program types. In 2024–25, nearly three-quarters of all international master’s students were enrolled in specialist programs.
5-Year Trend in Program Share of Total International Master's Enrollment
Distribution of 5-Year International Enrollment Change: MBA vs. Master’s Specialist
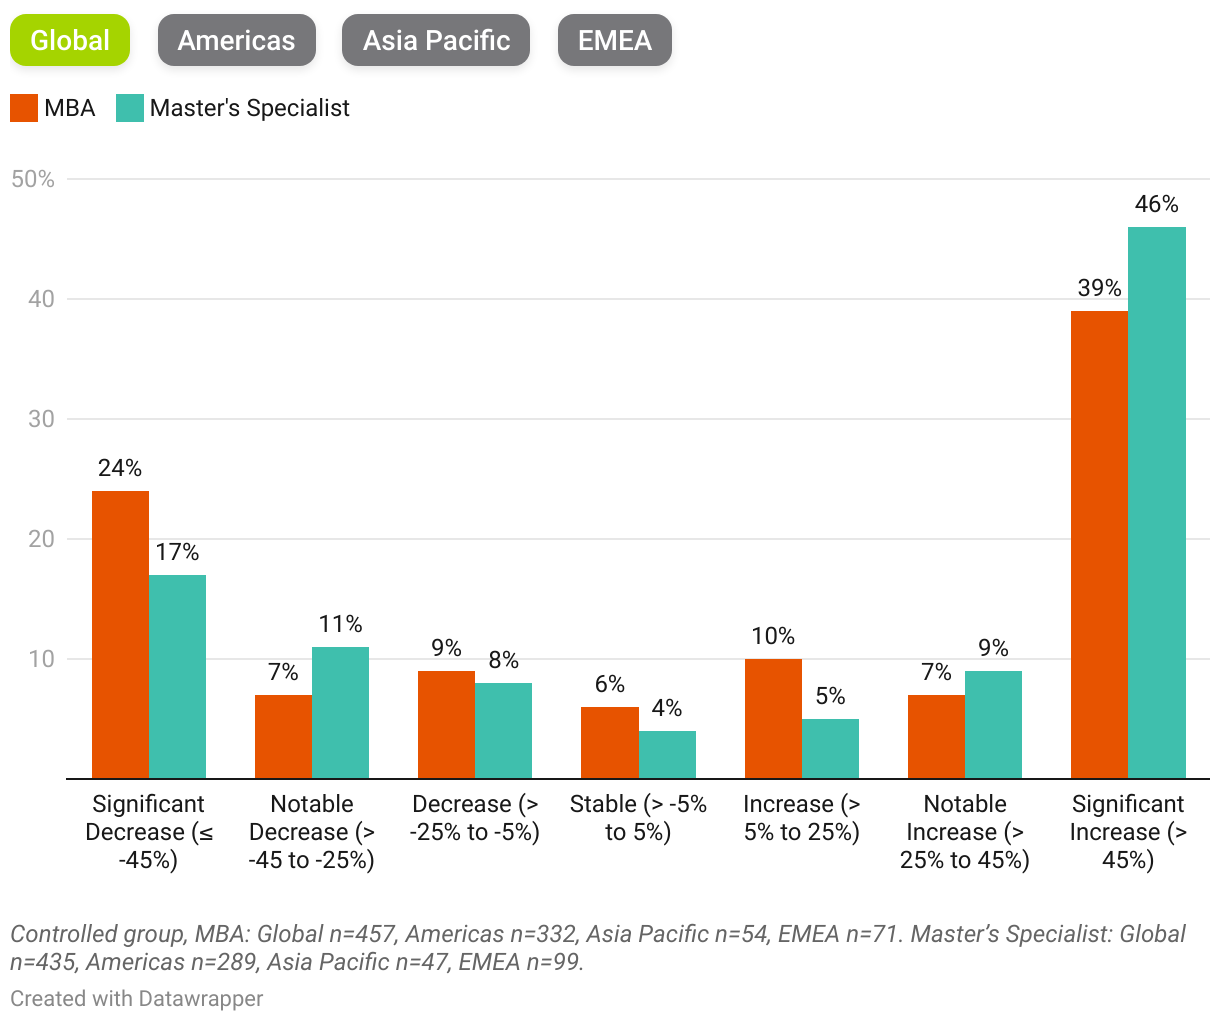
Master’s Specialist: As shown in the distribution chart below, the majority of schools, 62 percent, report growth in their international master’s specialist student enrollment over the past five years. Notably, 42 percent have experienced increases of 45 percent or more. The upward trend is even more pronounced in EMEA, where 69 percent of schools report growth. In the Americas, nearly half of institutions show surges of at least 45 percent in their international master’s specialist student counts over the same period.
MBA: For MBA programs, a smaller share of schools, 48 percent, report five-year growth in international student enrollment. The distribution is characterized by more pronounced movement at both ends of the scale, with the largest groups experiencing either declines of 45 percent or growth of 45 percent or more. In contrast to the specialist programs, EMEA schools are more likely to see declines: 55 percent report a five-year drop in international MBA enrollment, compared to 44 percent of schools in both the Americas and Asia Pacific.
5-Year Range of Change in International Master's Enrollment Counts: MBA vs. Specialist
Changes in Share of International Students Across Regions and Program Types
Regionally, we see patterns similar to those at the undergraduate level. Schools in the Americas continue to have the lowest representation of international students in their master’s programs, although the percentage is notably higher than at the undergraduate level. A key difference, however, is the shift in relative regional positioning: at the master’s level, schools in Asia Pacific most recently report higher international representation than those in EMEA, reversing the pattern observed at the undergraduate level, where EMEA institutions have the strongest international student presence.
Percentage of Master’s International Enrollment by Region
As in the undergraduate analysis, we also examine whether the share of international students within the master’s-level student body has shifted over the past five years.
Master’s Specialist: Consistent with the pattern observed in the actual count change, 60 percent of schools report an increase in the share of international students within their specialist master’s programs. Across all three regions, the largest concentration of schools is in the significant increase category (45 percent or more), indicating that a substantial proportion of institutions have experienced meaningful growth in international student representation relative to their overall enrollment trends.
MBA: For MBA programs, over half of schools (56 percent) report five-year growth in the share of international students. However, it is notable that around one-quarter of schools globally—and as many as 29 percent in Asia Pacific—report a substantial decline of more than 45 percent in international representation within their MBA cohorts.
5-Year Range of Change in Percentage of International Master’s Enrollment: MBA vs. Specialist
A Preview of International Mobility Trends
AACSB’s International Student Survey, conducted in fall 2025, was designed to provide an early preview of how undergraduate- and master’s-level international enrollment was developing for the 2025–26 academic year, specifically compared to the prior year. While the current dataset represents only an initial snapshot, and AACSB will continue collecting additional data throughout the 2025– 26 BSQ Programs Module cycle, the results offer an early indication of what member schools are experiencing.
We asked schools with access to current figures to report their total and international enrollment from the 2024–25 academic year, as well as their preliminary enrollment for the current year. This allowed us to assess year-to-year changes in both total and international enrollment at each program level. The charts below illustrate the distribution of annual enrollment changes for undergraduate and master’s programs, highlighting differences between total and international student growth.
Range of Annual Change in Total Enrollment vs. International Enrollment: Undergraduate
Range of Annual Change in Total Enrollment vs. International Enrollment: Master’s
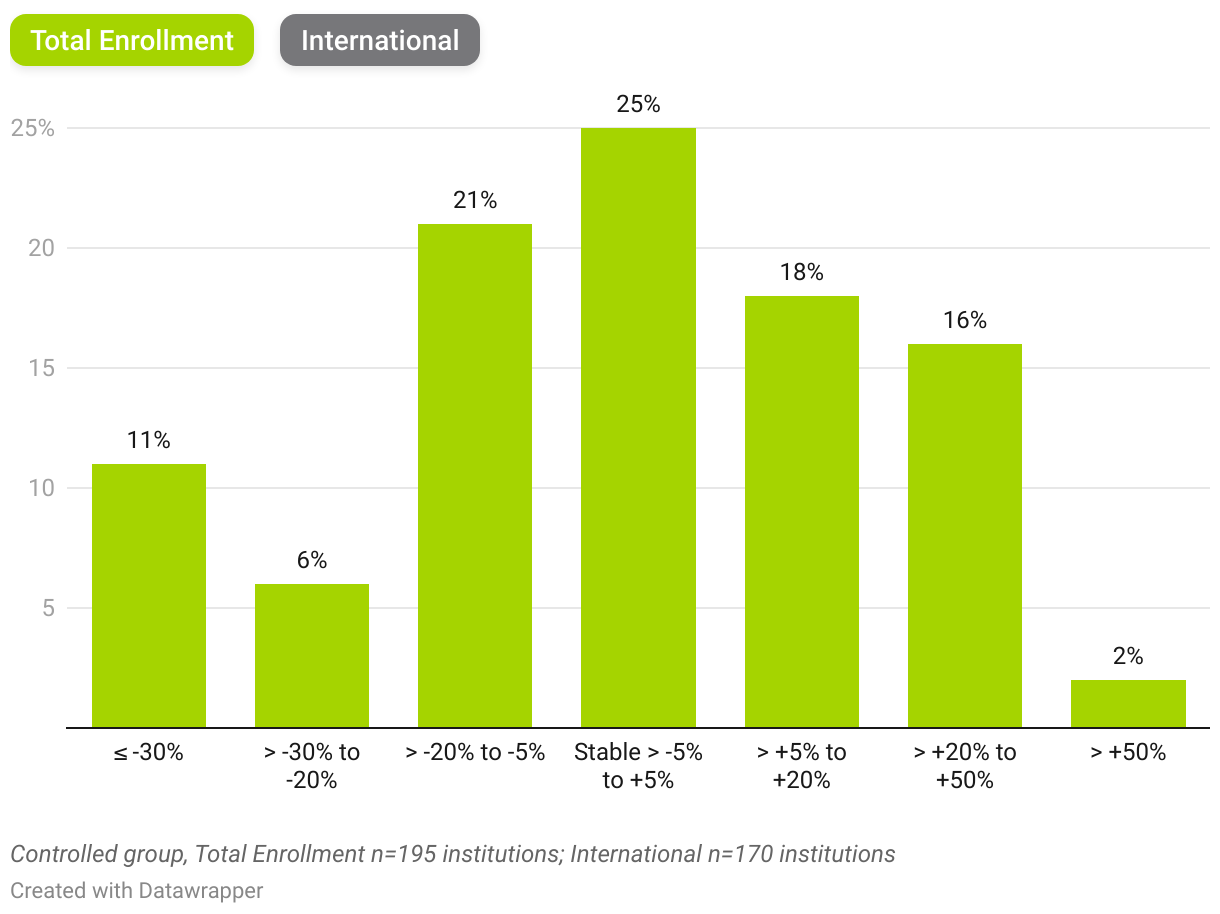
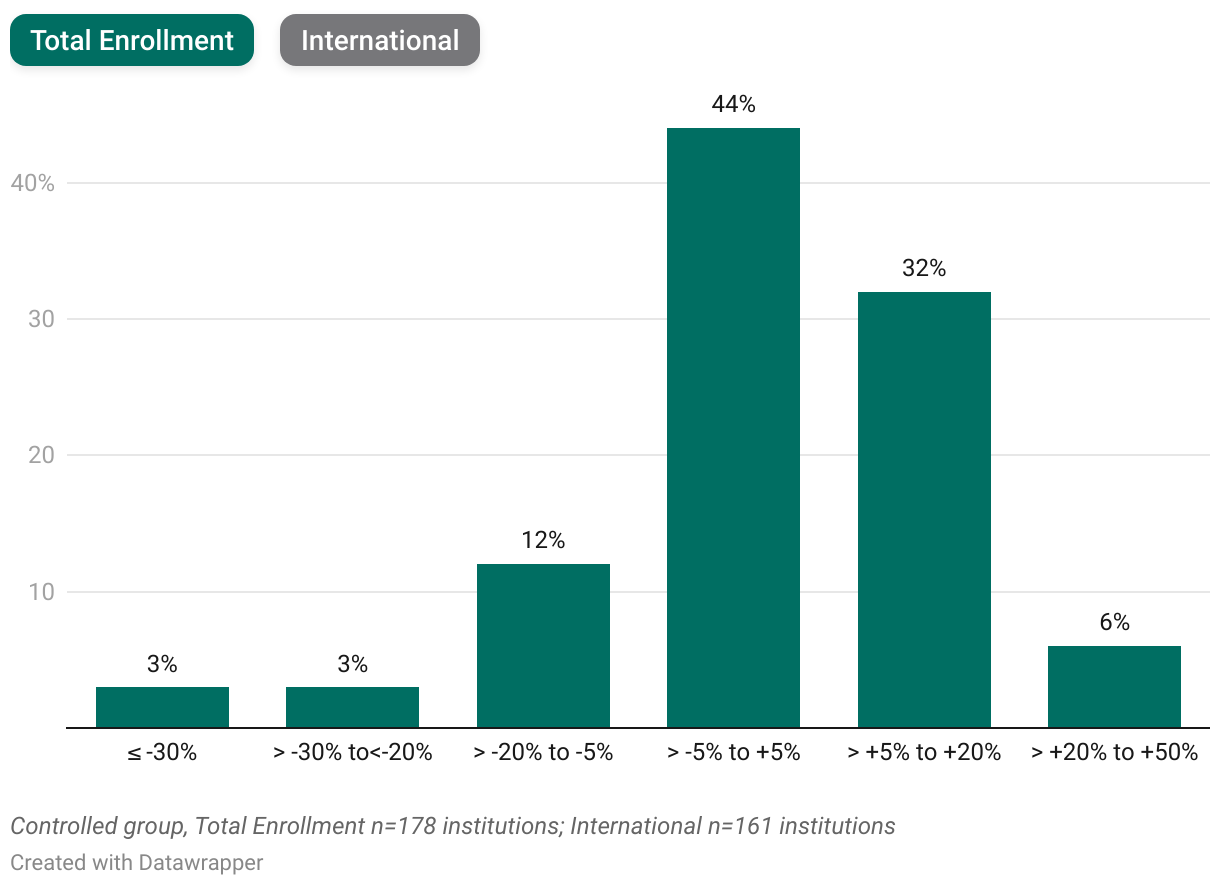
- Undergraduate level: The largest share of schools (44 percent) reports little to no annual change in total undergraduate enrollment (between -5 percent and +5 percent), followed by 38 percent that saw increases of 5 percent or more. Changes in international undergraduate enrollment are more widely distributed, likely reflecting the diverse regional and institutional contexts in which business schools operate. Nearly equal proportions of schools report increases and decreases in their international student counts over the past year.
- Master’s level: Total master’s enrollment changes are more evenly split between schools experiencing growth and those reporting declines, with about one-quarter noting little to no change. International enrollment patterns are also broadly distributed across categories, although a notable share of schools report a substantial annual decrease in international enrollment of 30 percent or more.
Beyond changes in enrollment counts, we also examine shifts in the share of international students.
We asked schools with access to current enrollment figures to report their total and international enrollments for the 2024–25 academic year as well as the current one. This glimpse allows us to assess shifts in international student representation. The charts below illustrate changes over the past year in the proportion of international undergraduate and master’s students, helping us understand whether interest in pursuing business education abroad is declining.
Range of Change in Share of International Undergraduate Students, 2024–25 to 2025–26
Range Change in Share of International Master’s Students, 2024–25 to 2025–26
Although the sample is limited, among schools that provided data, we observe the following patterns:
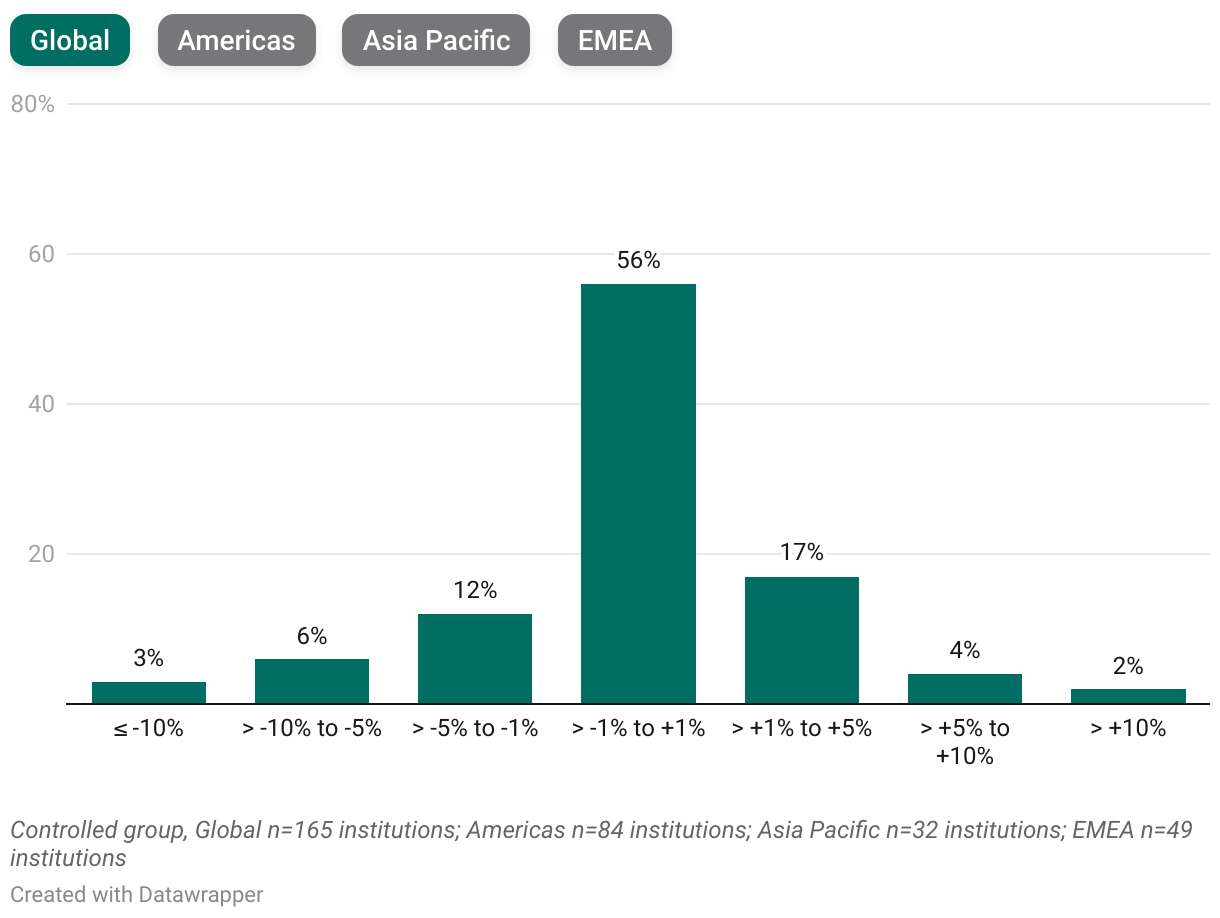
- Undergraduate level: A majority of schools (56 percent) report almost no change in the share of undergraduate international students. The next largest group—17 percent—reports an increase of 1 to 5 percent.
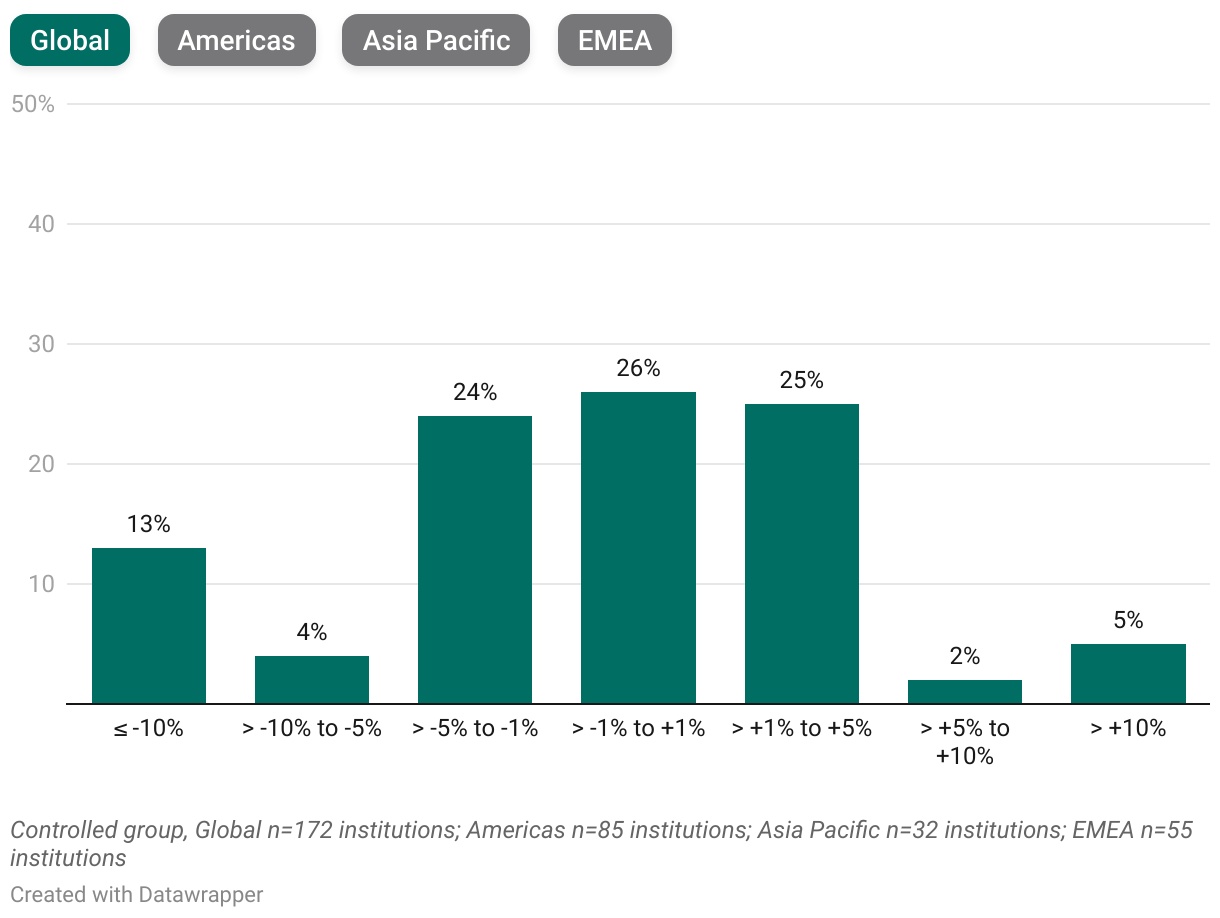
- Master’s level: Changes are more evenly distributed at the master’s level, particularly across the -5 to -1 percent, -1 to 1 percent, and 1 to 5 percent ranges, with each accounting for roughly one-quarter of reporting schools.
- Regionally: Regional patterns vary most at the master’s level, where a higher percentage of schools in the Americas report drops in international student share of total enrollment versus the other regions.
Overall, the preliminary results suggest that international student representation has shifted only minimally at both degree levels. As AACSB completes its collection cycle, the full sample will offer a more complete and definitive view of how international enrollment is evolving.
|
Recruitment Target Countries The fall survey also examines whether the source countries for schools’ international student recruitment at both the undergraduate and master’s levels have shifted over the past year. Key takeaways include:
|
Challenges in Attracting International Students
International student mobility and recruitment remain priorities for business schools worldwide, particularly as many countries introduce new regulations and policies related to immigration and international study.
To better understand the landscape, we asked business school leaders to rate the significance of various factors in attracting international students. The chart below shows the percentage of respondents in each region who identified these factors as a significant or very significant challenge.
Percentage of Significant or Very Significant Challenges in Attracting International Students by Region
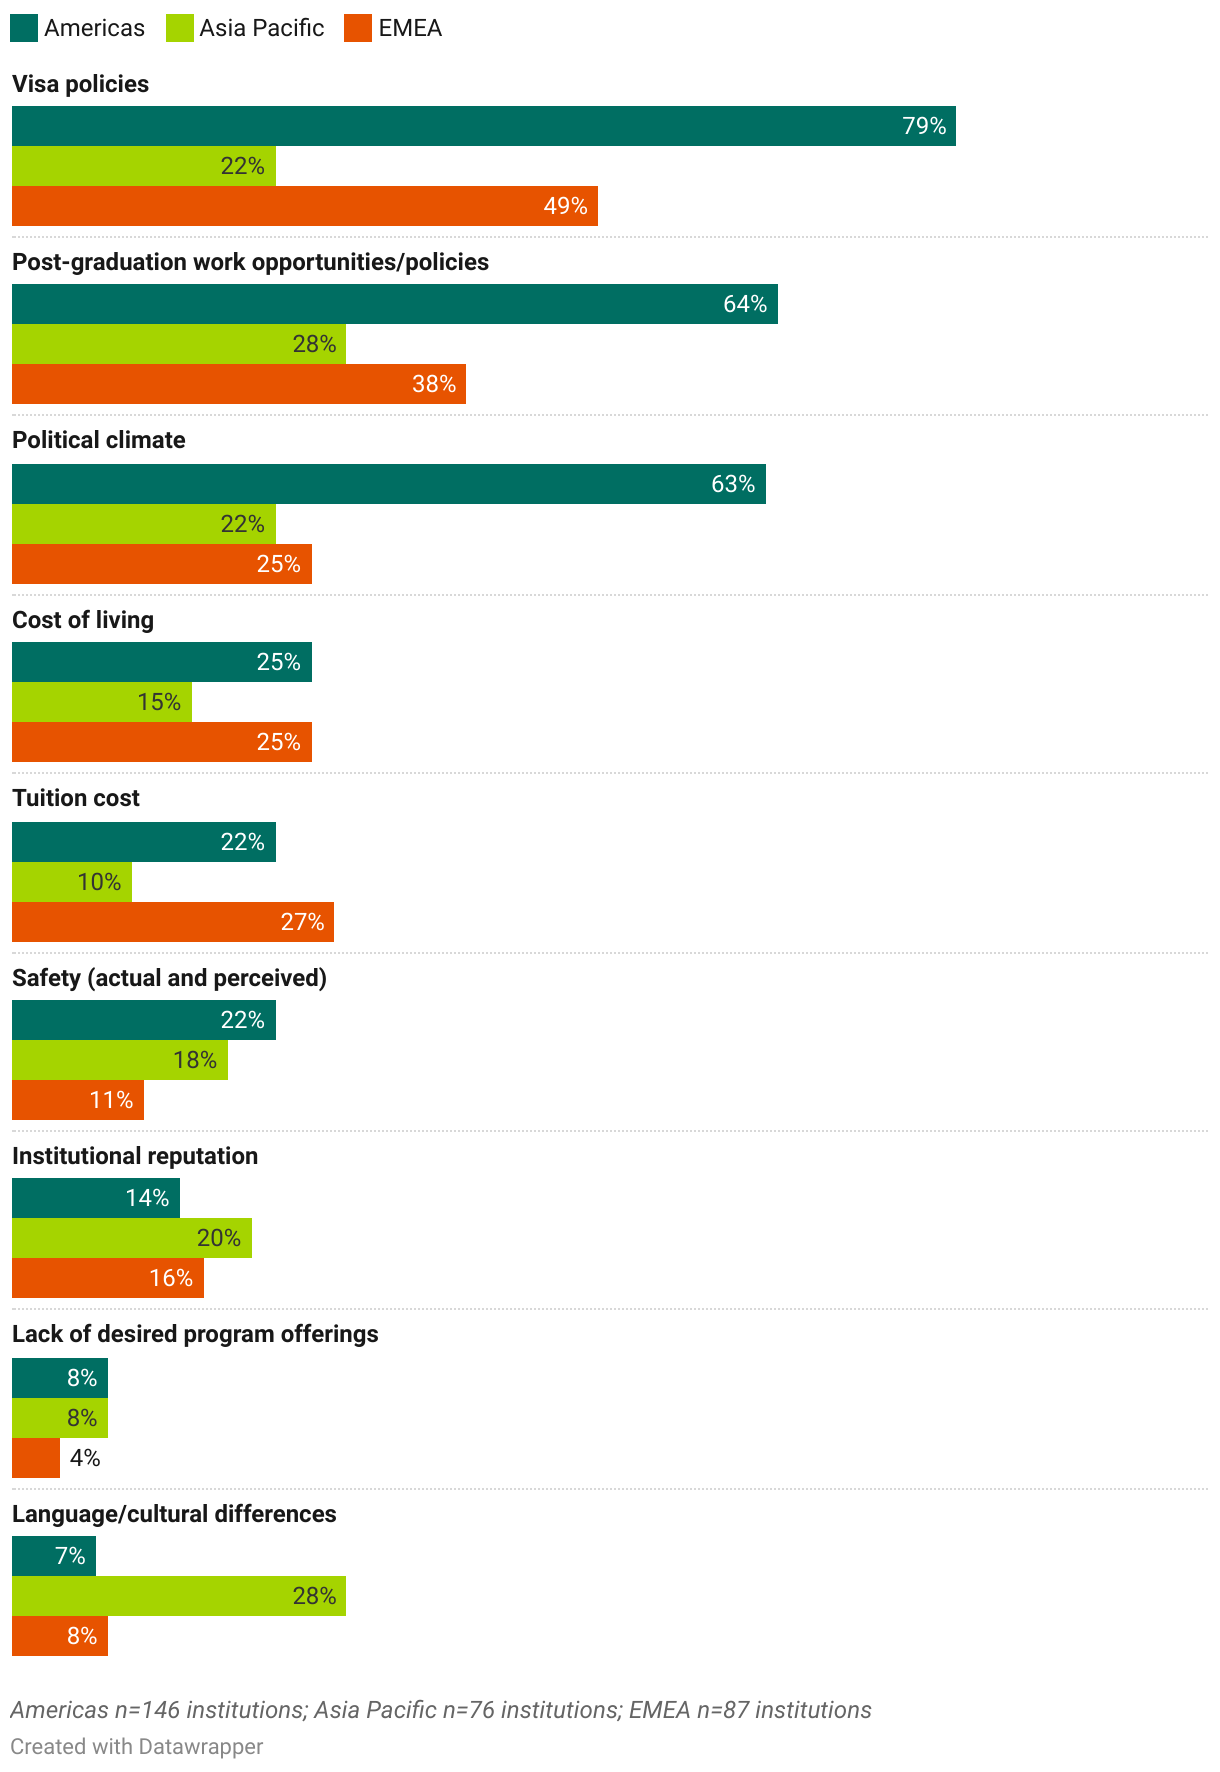
What Stands Out?
- Visa barriers are the biggest global challenge, especially in the Americas, where nearly eight in 10 schools say they significantly hinder international recruitment, dramatically higher than in EMEA (49 percent) and Asia Pacific (22 percent).
- Post-graduation work opportunities Schools in the Americas feel this most strongly, with almost two-thirds reporting these policies as a major obstacle.
- Political climate is a substantial challenge in the Americas, where 63 percent say it significantly affects their ability to attract international students.
- In EMEA, challenges are more balanced, but visa issues remain meaningful (49 percent). EMEA schools also emphasize institutional reputation more than other regions do.
- Asia Pacific’s challenge profile looks very different:
- Policy issues are less dominant compared to other regions.
- Language and cultural differences stand out (28 percent), making this region the only one where these issues rank at the top.
- Safety concerns are also positioned slightly higher than in other regions.
- Cost-related factors (tuition and cost of living) matter across all regions but are not the top barriers anywhere.
Country and Regional Developments Impacting International Student Mobility
The global geopolitical landscape is complex and rapidly evolving, presenting new challenges for international students in some regions while creating opportunities in others. The list below highlights a selection of major developments across different parts of the world that are shaping—and will continue to shape—international student mobility trends.
- Capped Student Intakes: Starting in late 2024, Australia introduced an annual cap (~270,000 places in 2025, rising to 295,000 in 2026) on new international student visas to ease pressure on housing and infrastructure. Universities are required to demonstrate adequate student housing and are encouraged to diversify their recruitment efforts.
- Visa Fee Increases: The base student visa application fee doubled from 710 AUD to 1,600 AUD (about 470 to 1,060 USD) in July 2024, and rose again to 2,000 AUD (around 1,325 USD) in July 2025, significantly raising the initial cost of studying in Australia.
- Workplace Protections: New legislation and pilot programs launched in 2024–25 ensure that international students can report workplace exploitation without risking visa cancellation. Employers face tougher penalties for violations.
- Student Permit Caps: In January 2024, a cap on new study permits was imposed, set at 485,000 for the year, to slow international student intake by about 35 percent, citing housing and service capacity concerns. The cap has continued in 2025–26 at 10 percent below the 2024 levels.
- Graduate Program Exemptions: Beginning January 2026, individuals admitted to master’s and doctoral programs at public will be exempt from the national study permit cap introduced earlier this year. This measure is designed to ensure that Canada continues to attract top academic talent while maintaining its broader intake management policies.
- New K Visa for STEM Graduates: Launched in October 2025, the K visa allows foreign STEM graduates to live and seek employment in China without needing a job offer, enhancing post-study opportunities.
- Digital Visa Processing: A new online visa system introduced in late 2025 streamlines application steps, improving efficiency and accessibility for student visa applicants.
- Growth Agenda: China will introduce a new Undergraduate Entrance Academic Proficiency Test to strengthen admissions standards for international applicants. Scholarship policies are also shifting away from pre-college preparatory programs toward degree-level study, reflecting a broader effort to raise the academic caliber of incoming students. In 2024, China introduced the Youth Exchange Students Program to encourage American scholars to pursue study and exchange opportunities in China, offering visa fee waivers and targeted financial support for academic and cultural activities.
- Special Student Visa Categories: India introduced two new education-only visas—the e-Student Visa for admitted international students and the e-Student Dependent Visa (also called e-Student-X Visa) for dependents of e-Student Visa holders—available exclusively through the Study in India (SII) portal. The system links admissions with visa issuance, enabling SII-partner university admits to apply using their SII ID. The change is expected to expedite approvals, especially for applicants from neighboring and African countries.
- Foreign University Campuses in India: The University Grants Commission’s 2023 regulations allow top globally ranked universities to establish autonomous campuses in India, setting their own curricula, admissions, and fees while awarding home-campus degrees. In mid-2025, the University of Southampton (U.K.) became the first approved campus, with five more—Illinois Institute of Technology (U.S.), University of Liverpool (U.K.), Victoria University and Western Sydney University (Australia), and Istituto Europeo di Design (Italy)—planning 2026–27 openings.
- Inbound Scholarship Programs (Brazil): In 2025, Brazil expanded funding for international postgraduates. The International Cooperation Group of Brazilian Universities’ fourth International Mobility Program opened with more than 850 fully funded master’s and PhD scholarships for 2026 entrants. Shortly after, the Coordination for the Improvement of Higher Education Personnel, with the Ministry of Foreign Affairs and the National Council for Scientific and Technological Development, announced 650 new Graduate Student Exchange Program awards, backed by 41 million BRL (around 7.73 million USD) and monthly stipends of 3,100 BRL (585 USD) for PhD students and 2,100 BRL (396 USD) for master’s students, plus health insurance.
- Bilateral Mobility Agreement (Mexico): In December 2024, Mexico and China signed a five-year higher education cooperation pact to expand student and researcher exchanges, launch joint programs, and establish mutual degree recognition. The agreement supports Mexico’s goal of adding 330,000 new public university seats over six years.
- Foreign University Branch Campuses (Saudi Arabia): In 2025, Saudi Arabia issued investor licenses to five foreign universities (including Arizona State and Wollongong) to open local branch campuses in priority fields such as healthcare and engineering, supporting higher-education expansion under its Vision 2030 strategic roadmap.
- Dubai Higher Education Strategy 2033 (United Arab Emirates): Launched in June 2025, the Education 33 strategy introduces a new student visa system dedicated graduate work visas, international scholarship programs, and plans to grow foreign branch campuses from 37 to more than 70, with a target of 50 percent international student enrollment by 2033.
- International University Partnerships (Egypt): In January 2025, Egypt approved a new partnership between Ain Shams University’s international campus and the University of Exeter in the U.K., expanding the roster of foreign branch campuses and dual-degree collaborations.
- Erasmus+ Reassociation: In May 2025, the U.K. signaled plans to rejoin Erasmus+ as part of a broader reset in EU relations. If finalized, the agreement would restore reciprocal, fee-free exchanges for U.K. and EU students, and operate alongside the outbound-only Turing Scheme.
- Immigration White Paper Proposals: The May 2025 white paper proposed shortening the graduate route visa from two years to 18 months and introducing “responsible recruitment” obligations tying universities’ visa-sponsorship rights to student outcomes. These proposals remain under review.
- International Education Policy Climate: Reporting in 2025 highlights concerns that tighter migration rules and uncertainty around the graduate route are straining university finances and competitiveness, prompting greater focus on transnational education and calls for a more stable long-term international education strategy.
- H-1B Visa Fee: According to a 2025 proclamation, the White House implemented a new 100,000 USD fee for employers filing H-1B visa applications after September 21, 2025.
- Student and Exchange Visitor Information System (SEVIS) Terminations: A new policy gives the Immigration and Customs Enforcement agency more expansive authority to terminate students’ SEVIS status for reasons like “evidence of failure to comply” with visa terms or visa revocations.
- Increased Interview Scrutiny: In 2025, the Department of Homeland Security temporarily suspended Harvard University’s authorization to sponsor international students, indicating heightened federal scrutiny of university visa compliance and raising concerns about broader impacts on international enrollment.
Program Delivery Trends
This section explores recent trends in program delivery, comparing enrollment across full-time and part-time formats and assessing how institutions are using different delivery models to respond to student preferences and market needs.
Part-Time vs. Full-Time Enrollment
Undergraduate Programs
5-Year Trend of Full-Time vs. Part-Time Enrollment: Undergraduate
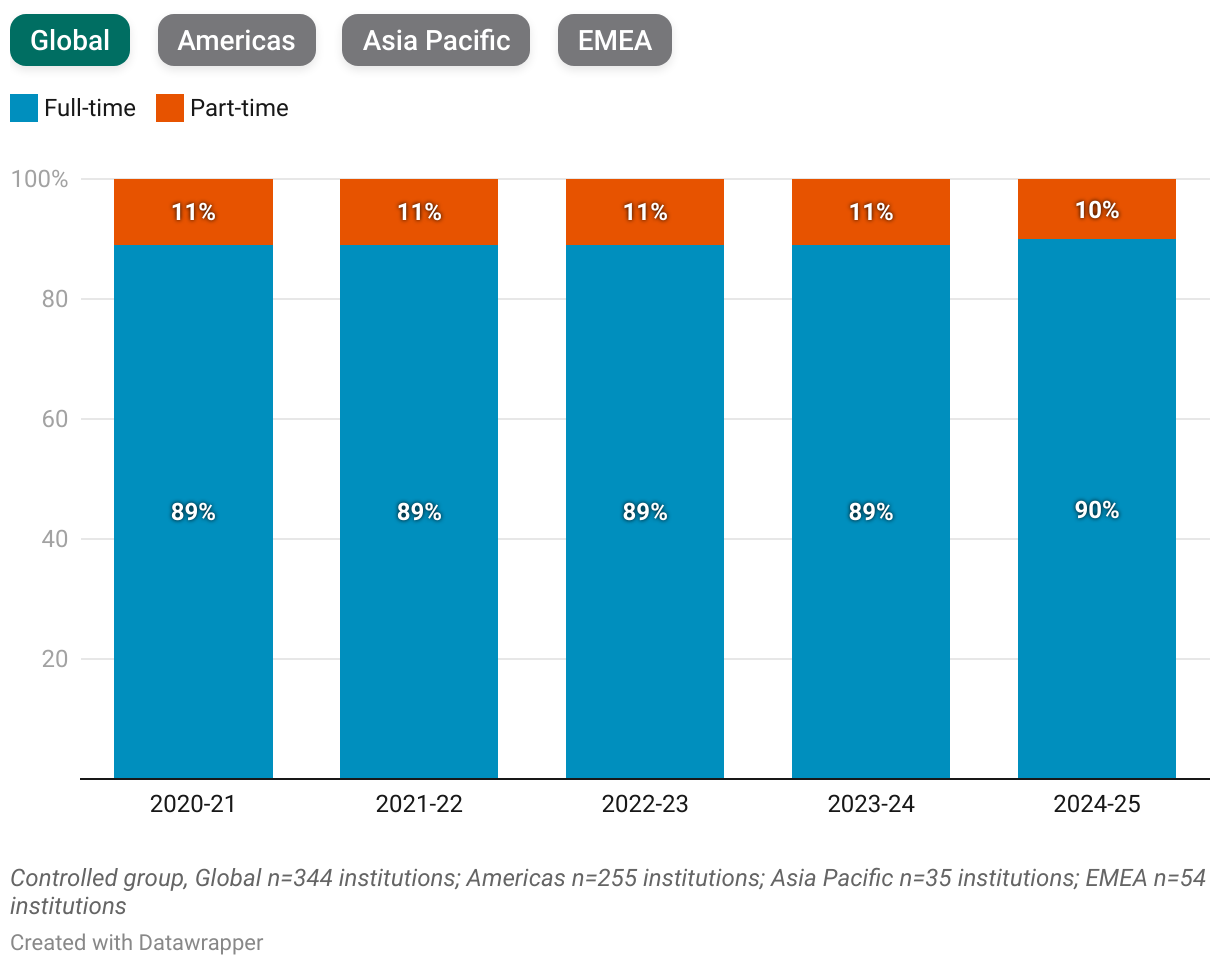
Full-time enrollment at the undergraduate level remains the norm across regions, with roughly 90 percent of undergraduate students completing their studies on a full-time basis. Asia Pacific shows a slightly higher share of part-time undergraduate students compared to EMEA and the Americas.
Master’s Programs
At the master’s level, more varied patterns emerge. These programs often attract students who are between careers or working professionals, and institutions have increasingly adjusted program structures to better meet the needs of these markets. As a result, the balance between full-time and part-time enrollment is more dynamic and reflects both student preferences and evolving program delivery models.
5-Year Trend of Full-Time vs. Part-Time Enrollment: Master’s
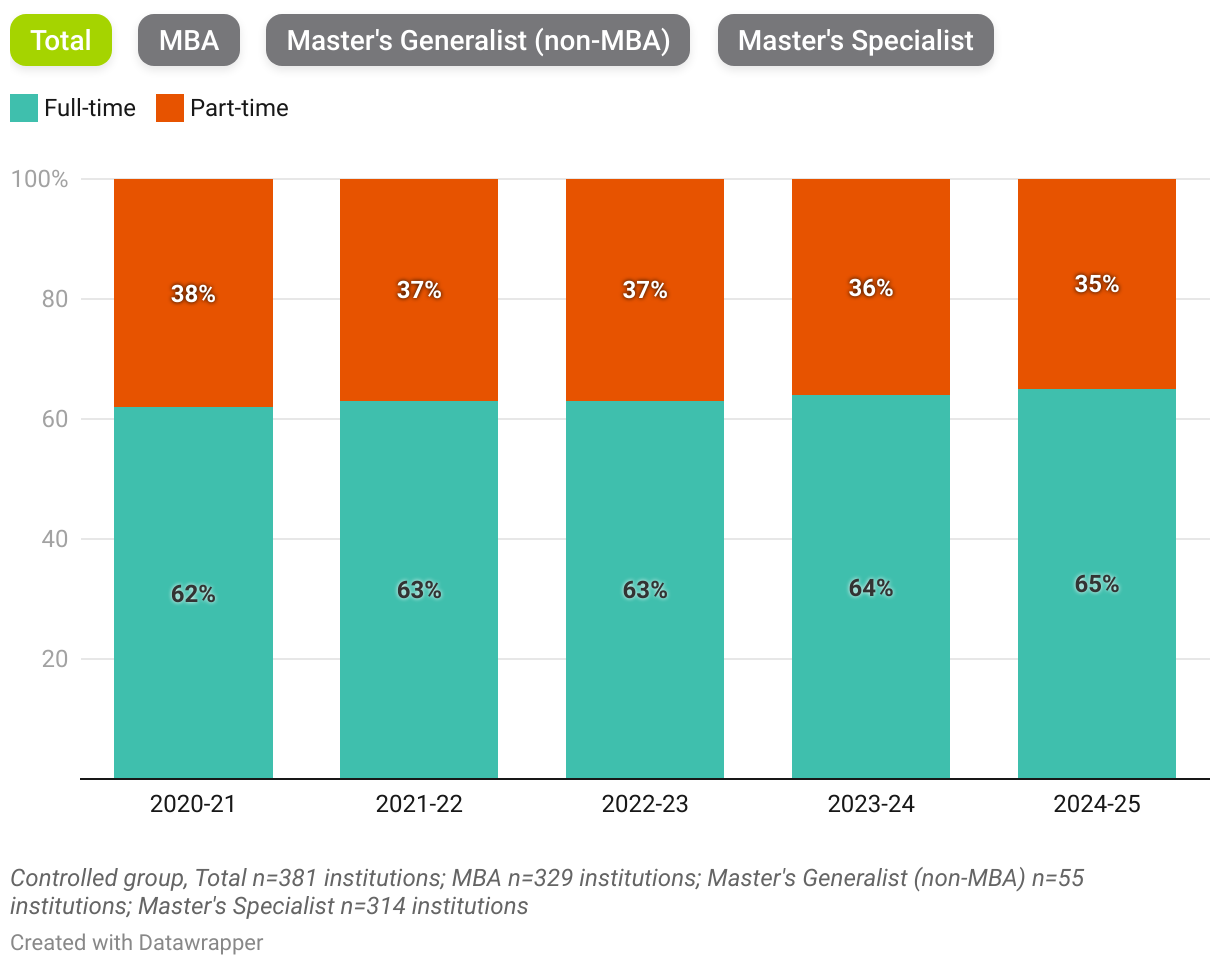
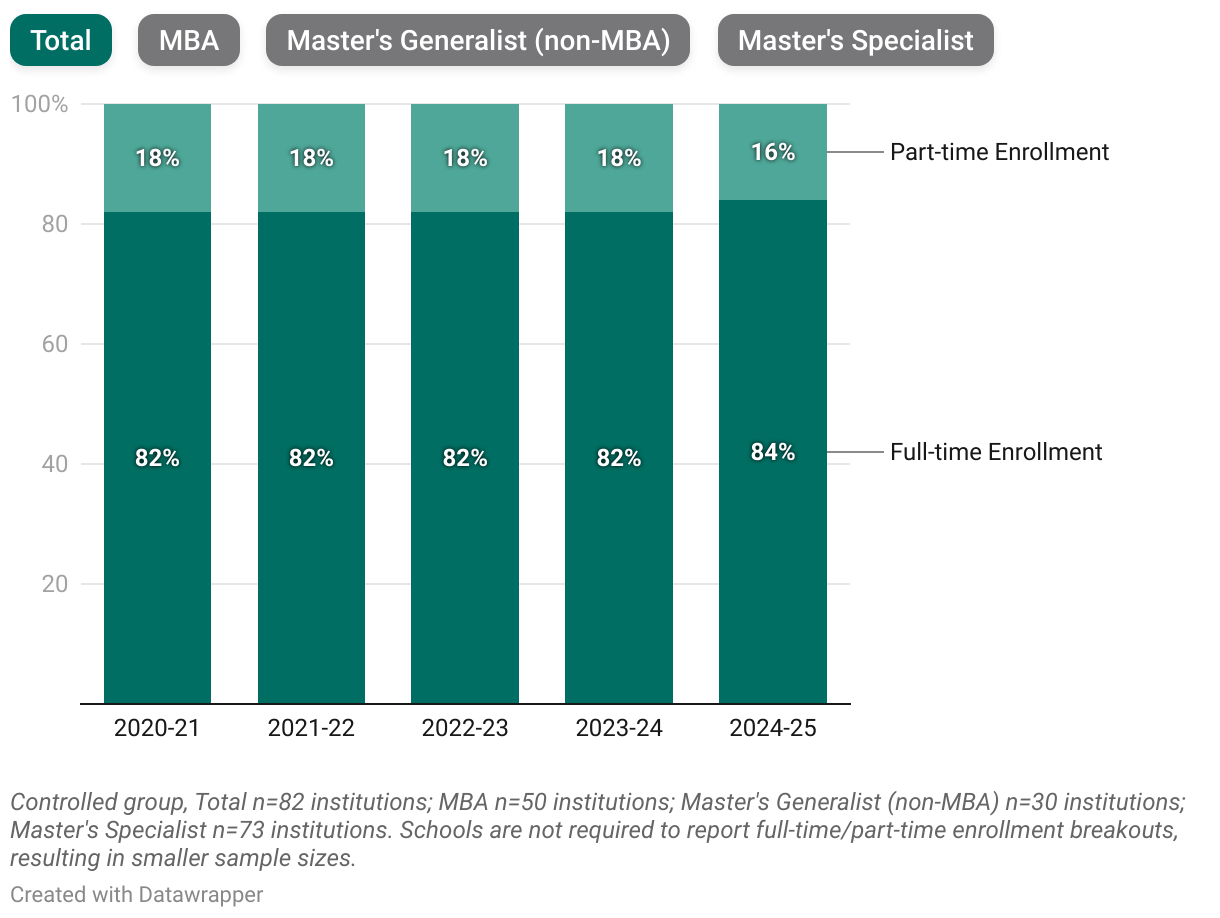
Overall, master’s students are more likely to study full-time, but this tendency varies considerably by program type. MBA programs show the opposite pattern, with about 60 percent of students enrolled part-time, a proportion that has remained steady over the past five years. Master’s specialist programs, by contrast, are consistently attended full-time, with roughly three-quarters of students studying full-time each year.
Regional Variations
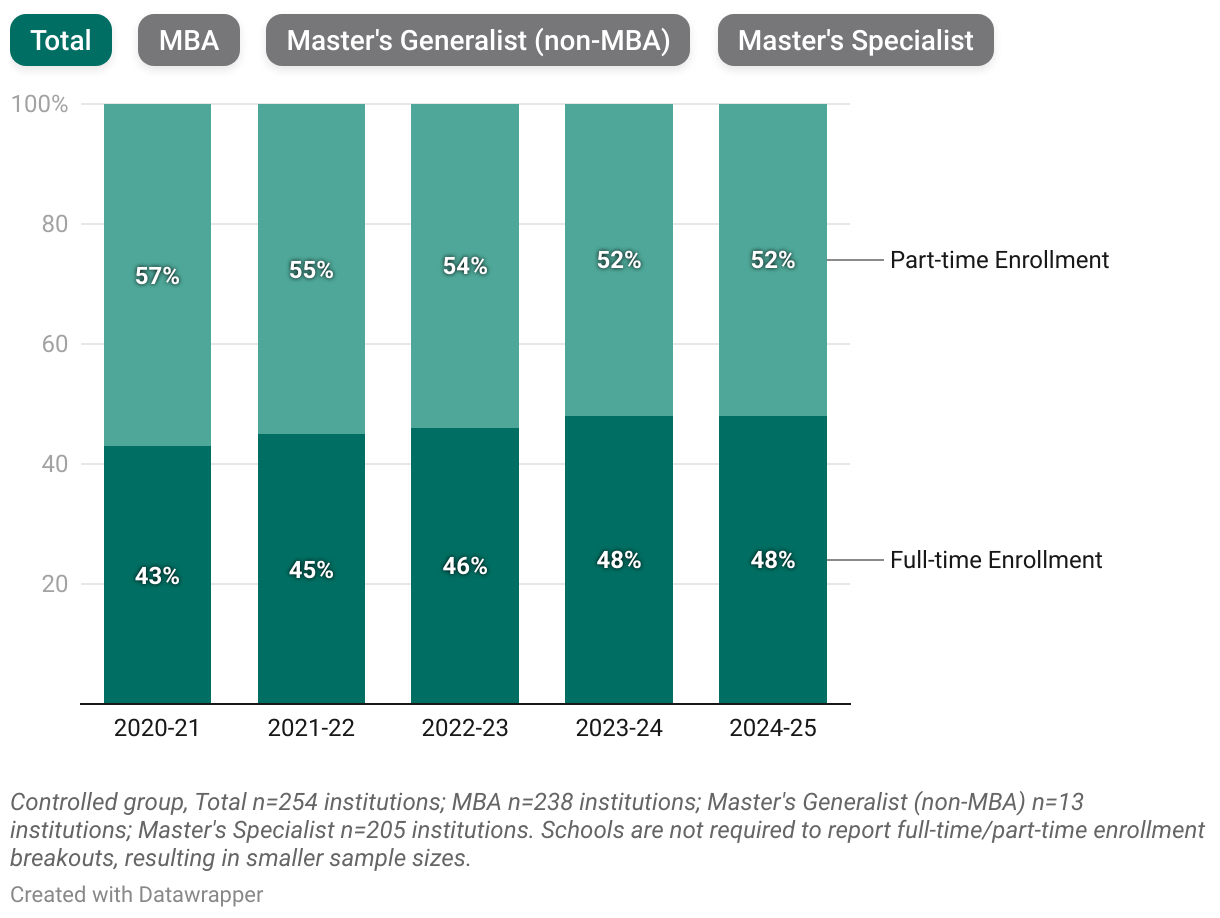
Full-Time vs. Part-Time Enrollment by Master’s Program: Americas
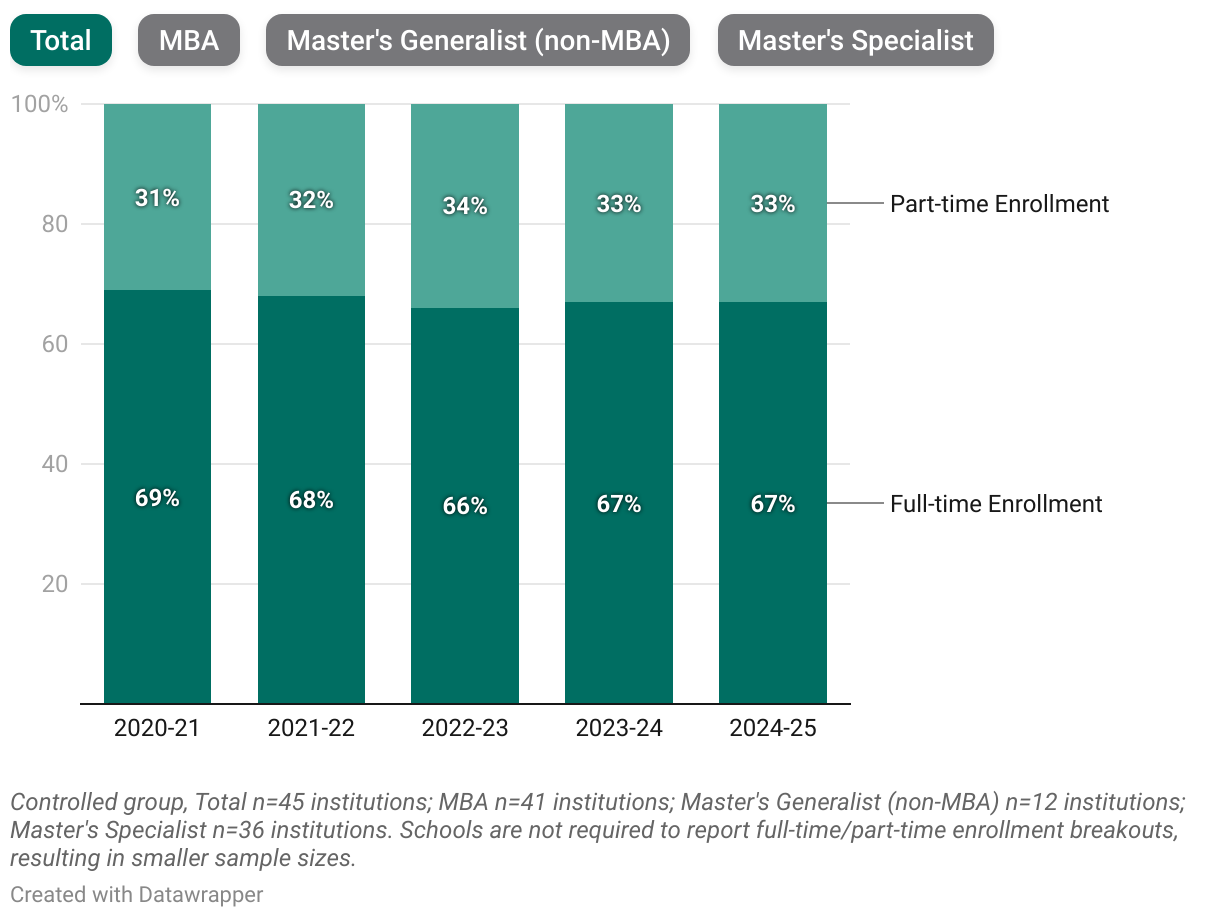
Full-Time vs. Part-Time Enrollment by Master’s Program: Asia Pacific
Full-Time vs. Part-Time Enrollment by Master’s Program: EMEA
- Most master’s students in Asia Pacific and EMEA study full-time, whereas in the Americas most students enroll part-time.
- At the MBA level, part-time study is more common across all three regions, with notable recent growth in Asia Pacific and EMEA.
- Master’s specialist programs remain predominantly full-time in all regions, especially in EMEA.
Variation in MBA and Master’s Specialist Format Offerings by Region
When interpreting these analyses, it is important to consider the institutional, geographic, and contextual factors that shape program formats. At many institutions, certain programs are offered exclusively in either a full-time or part-time format, which influences enrollment patterns.
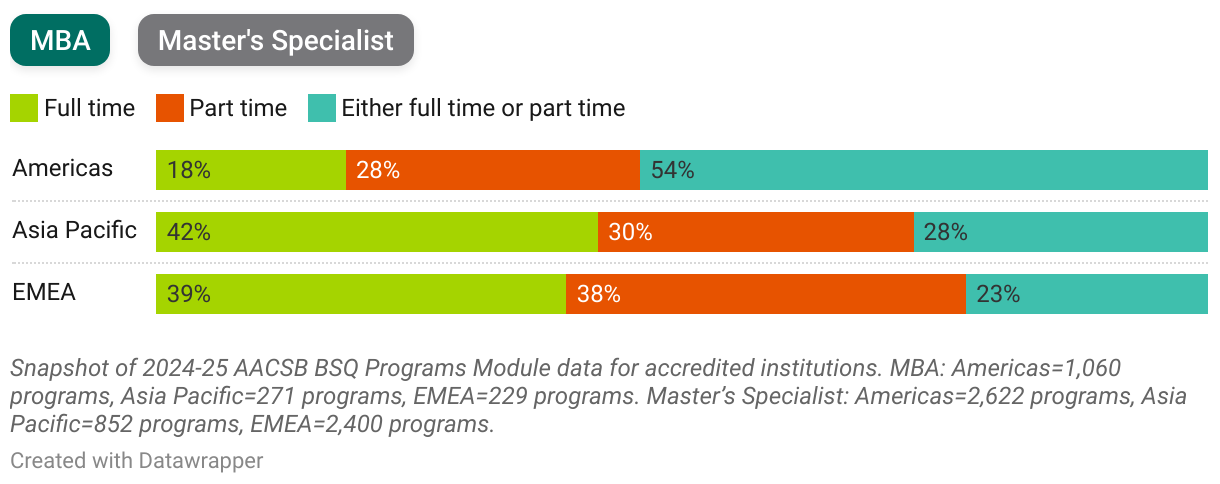
Snapshot data from 2024–25 for accredited schools show notable regional variation in the structure of MBA and master’s specialist programs. In EMEA, most specialist programs are available only in a full-time format, whereas institutions in the Americas and Asia Pacific tend to offer greater flexibility, allowing learners to choose between full-time and part-time study. MBA programs, by contrast, are less likely to be delivered exclusively full-time, reflecting a broader emphasis on flexible pathways for working professionals.
Program Delivery Trends
New technologies, evolving engagement preferences, and a broader appreciation for diverse learning styles have led schools to expand the range of delivery formats offered in their programs. While AACSB does not track delivery types for undergraduate programs, the analysis below highlights trends in delivery modes for master’s-level students.
AACSB Definitions for Delivery Types
Below are the delivery method definitions from AACSB’s Business School Questionnaire, which schools can optionally use to report their enrollment figures.
- Face-to-face: The program is fully completed in person on one of the school’s campuses.
- Multimodal or blended/hybrid: In the visuals below, these are combined into one category.
- Multimodal:The program offers both face-to-face and online courses, allowing students to choose either format for each class, possibly taking both online and in-person courses during the same term.
- Blended/hybrid: The program requires students to take both in-person and online courses, with some courses offered only online, some only in-person, and some a mix of both. The school, rather than the student, determines which courses are taken in person or online.
- Online: The visuals below combine the following two types of online programs into a single “online” category:
- Primarily online: The program can be fully completed online, although it may include some in-person requirements for activities like orientation or proctored testing.
- Exclusively online:The program can be completed 100 percent online, with no in-person requirements for any part of the program, including orientation or testing.
MBA vs. Master’s Specialist Enrollment by Delivery Type
5-Year Trend of Enrollment by Delivery Type: MBA
5-Year Trend of Enrollment by Delivery Type: Master’s Specialist
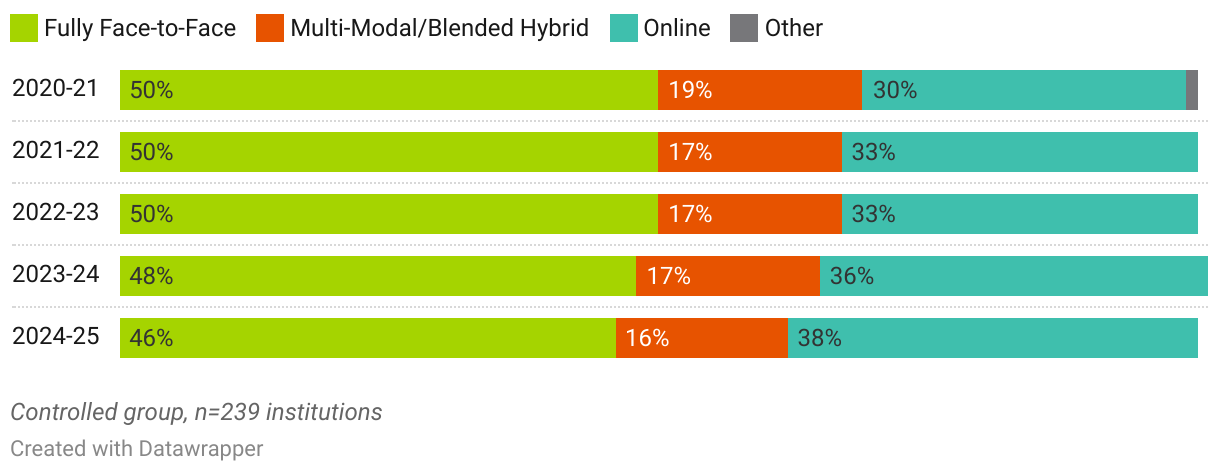
For MBA programs, about half of students are enrolled in a fully face-to-face format, although this share has gradually declined to 46 percent in the most recent year. Enrollment in fully online MBA programs, by contrast, has steadily increased, from 30 percent in 2020–21 to 38 percent in 2024–25, indicating a growing preference for greater flexibility and accessibility, most likely among working professionals. This trend is further reinforced by the increasing number of well-regarded schools offering fully online MBA options. Together, these shifts indicate evolving student expectations, stronger and more competitive online program offerings, and greater employer acceptance of digitally delivered graduate credentials.
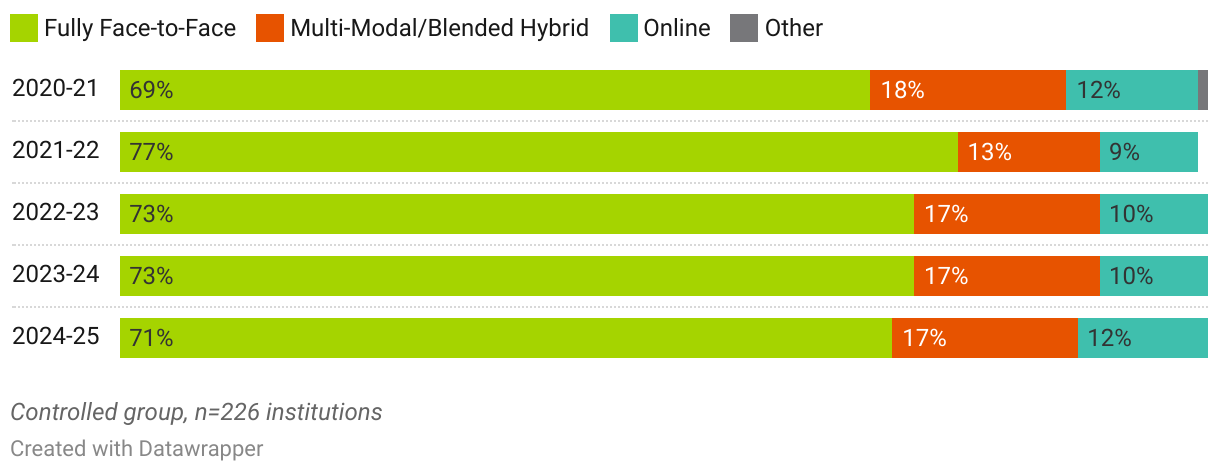
Enrollment trends by delivery type for master’s specialist programs show more year-to-year variability but return to baseline levels in 2024–25: 70 percent of students are enrolled in face-to-face programs, 17 percent in multimodal or blended formats, and 12 percent in fully online programs. This distribution suggests that specialist programs, which often serve pre-experience or early-career students, continue to rely more heavily on in-person learning while gradually incorporating flexible delivery options.