


New Insights on Business School Salaries and Demographics
Data from the 2019–20 Staff Compensation and Demographics Survey (SCDS), the most globally comprehensive data source of business school staff salaries in the world, are now available. This is the 52nd year that AACSB has collected data on faculty and staff. This year, 514 AACSB member schools representing a record number of 37 countries and territories participated. The results for this year include information for 34,621 full time business school faculty members across 35 business fields, along with data on 4,828 administrators.
As a part of their member benefits, participating schools can log in to DataDirect and not only have access to this year's data but all previous years' survey data. They can select their own set of participating peer schools against which to benchmark trends. In addition, overview reports that consist of aggregate reports of all data submitted before the deadline can be accessed for free by participating members. Overview reports are available for purchase by individuals at non-participating schools, or those without the required access levels.
Also available publicly is the SCDS Executive Summary. This year the summary features not only aggregated information about all participating member schools’ faculty and staff salaries, but also information about the average amount of time faculty members have been at their current institution. These data are grouped by discipline and faculty qualification types.
Last year, we shared some information about a unique feature of the SCDS, where information specific to AACSB faculty qualifications is collected. Full-time faculty members are categorized as either being a Scholarly Academic (SA), Practice Academic (PA), Scholarly Practitioner (SP), Instructional Practitioner (IP), or Unknown/Other (UN_Other). These categories, which are derived from the 2013 standards for accreditation, are based on the faculty members’ initial academic preparation, initial professional experience, and sustained academic and professional engagement.
For this year’s set of data, a majority of the full-time faculty (approximately 72 percent) are categorized as SA. This is also the case at each individual faculty rank, except for the instructor rank, where only 19 percent are categorized as SA and approximately 50 percent are categorized as IP (see Table 1).
Table 1. Percentage of Full-Time Faculty by Rank and Qualification
| Faculty Qualification | ||||||
|---|---|---|---|---|---|---|
| Faculty Rank | SA | PA | SP | IP | UN_Other | Number of Faculty |
| Professor (Highest Faculty Rank) | 88% | 6% | 1% | 1% | 3% | 9,195 |
| Associate Professor (Second Faculty Rank) | 83% | 7% | 2% | 2% | 6% | 9,060 |
| Assistant Professor (Third Faculty Rank) | 86% | 4% | 2% | 4% | 4% | 9,296 |
| Instructor (Fourth Faculty Rank) | 19% | 13% | 10% | 50% | 8% | 7,070 |
| Number of Faculty | 24,978 | 2,523 | 1,161P | 4,227 | 1,732 | 34,621 |
| Percentage of Faculty | 72% | 7% | 3% | 12% | 5% | 100% |
Average Salaries for Full-Time Faculty
Reporting individual full-time faculty salary data is optional on the SCDS, and this year 499 schools reported salary information for 33,440 full-time faculty. Salaries are reported as either nine-to-10-month (academic year) or 11-to-12-month (calendar year) annual contracts. For comparability, the data for this report were converted to U.S. dollars (USD) and 11-to-12-month salaries were multiplied by 0.818 to convert them to nine-to-10-month salaries.
The average salary across all full-time faculty was 131,000 USD. The average salary across all professors (or highest faculty rank, by whatever name) was 170,000 USD, for associate professors (or second faculty rank) it was 133,000 USD, for assistant professors (or third rank) it was 124,000 USD, and for instructors (or fourth rank) the average salary was 84,000 USD. When these figures are broken out by faculty qualifications, there is some variability across the ranks (see Figure 1).
For all categories except PA, the order of average salaries aligns with rank such that the average professor salary was highest, followed by associate professors, assistant professors, and instructors, respectively. For PA, professors and associate professors were still the highest and second-highest average salary, but in this category the average for instructors was higher than the average for assistant professors (103,000 USD vs. 95,000 USD, respectively).
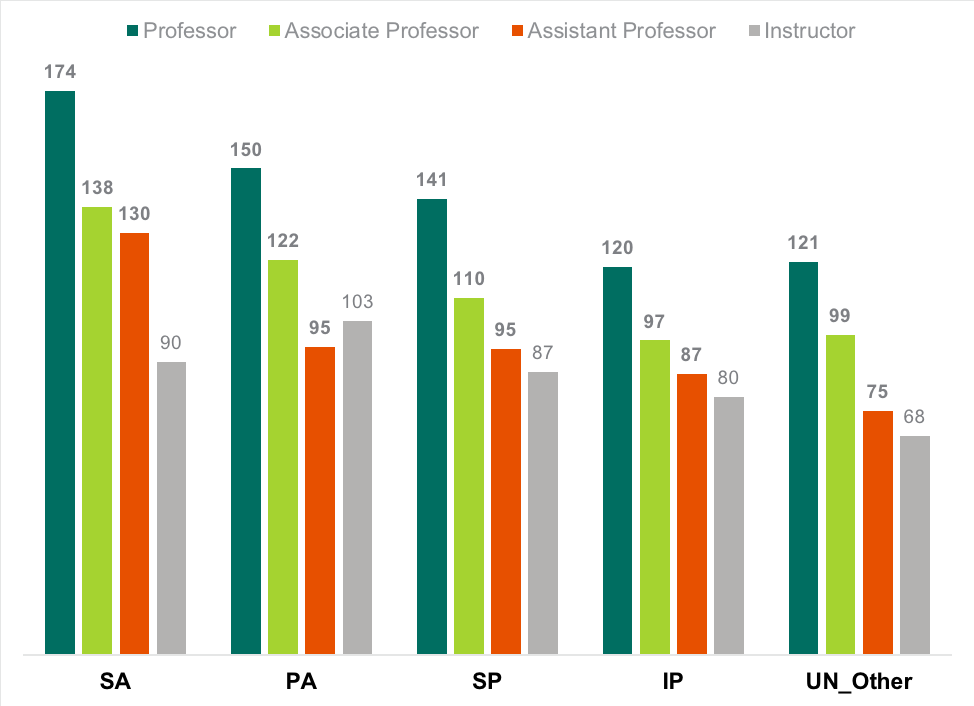
Figure 1: Average Faculty Salaries by Rank and Qualifications
Demographics such as rank, qualifications, year hired, tenure status, and academic discipline are also a part of the SCDS data for full-time faculty. In addition, aggregated data on participating and supporting headcounts for both part-time and full-time faculty are also available.
More information on the types of data available in the SCDS via DataDirect can be found here in our AACSB Data Glossary. As always, please contact the AACSB BEI Business Education Intelligence team at [email protected] with any questions.