


The State of the Business School Budget
- The average operating budget for AACSB-member business schools steadily increased over the last five years—with schools in the EMEA region seeing the largest boost.
- The 74 business schools that submitted data for the net flow portion of the BSQ Finances module averaged a positive net flow of nearly 20 million USD, representing their contribution to their parent universities.
- For most schools, 80 percent of funding was generated by general tuition and fees, consistent with past survey findings
In a December 2022 article, we highlighted findings from AACSB’s 2021–22 Business School Questionnaire (BSQ) Finances Module that shed light on how business school finances impact faculty engagement. Here, we share further insights from the survey about the financial status of business schools, including some key changes over time. (Overview reports from the survey, with additional findings, are available through DataDirect.)
Overall, our latest survey shows that business schools’ operating budgets increased over the past five years. In addition, most business schools are in the position of contributing significant funds back to their parent universities, particularly among those that are privately controlled. We explore these and other findings in more detail below.
Operating Budgets Are on the Rise
When we analyzed a controlled set of data across five years, we found that the mean operating budget amount for participating business schools rose by just over 3.5 million USD between 2017–18 and 2021–22, representing a 13 percent increase (see graphic below).
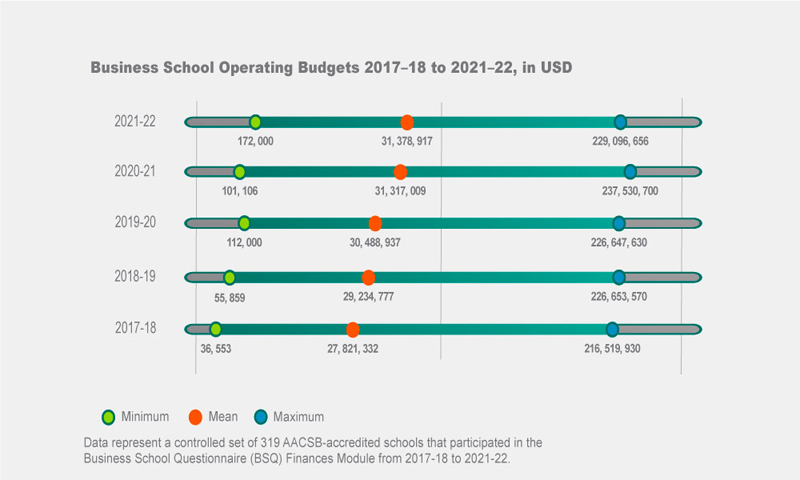
However, the funds that individual schools have at their disposal varies widely. For instance, the maximum budget that a school reported in 2021–22 (229 million USD) was over 600 percent more than the mean (just over 31 million USD).
Not surprisingly, our 2021–22 survey shows that large schools had larger average budgets (58 million USD) than medium-sized (17 million USD) or smaller institutions (6.6 million USD). Since 2017–18, large schools saw their average budgets increase by 15 percent; medium schools, by 5 percent; and small schools, by 8 percent.
| FIGURE 1. Budgets (in USD) by School Size Over 5-Year Span | ||||||
|---|---|---|---|---|---|---|
| School Size | 2017–18 | 2018–19 | 2019–20 | 2020–21 | 2021–22 |
Percentage |
| Large | 50,530,331 | 52,833,573 | 55,435,905 | 56,801,313 | 57,994,243 | +15% |
| Medium | 16,161,089 | 16,381,242 | 16,542,928 | 17,308,117 | 17,012,626 | +5% |
| Small | 6,108,372 | 6,309,644 | 6,370,297 | 6,715,226 | 6,606,264 | +8% |
Private and public schools both experienced budget increases over the last five years, although publicly controlled business schools saw the bigger jump. Public schools saw their operating budgets increase by an average of 17 percent, compared to only 4 percent for privately controlled business schools. In the most recent year of the survey, publicly and privately controlled business schools had similar budgets—32 million USD and 31 million USD, respectively.
Biggest Boost in Eastern Asia
When we broke the numbers out by region, schools in North America saw the smallest jump in their budgets, while schools in the Europe, Middle East, and Africa (EMEA) region reported the largest. From 2017–18 to 2021–22, the average business school budget increased:
- By 11 percent in North America, from 26 million USD to 29 million USD. For 2021–22, the maximum budget reported in this region was 229 million USD (the largest reported by any school in our survey), while the minimum budget reported was 172,000 USD. This finding shows the wide range that exists among schools in this region.
- By 14 percent in Asia Pacific, from 22 million USD to 25 million USD. Average budgets for schools in Eastern Asia grew the most during this time period, from 18 million USD to 25 million USD—a 37 percent increase in the subregion.
- By 26 percent in EMEA, from 51 million USD to 64 million USD. Schools in the Middle Europe subregion reported the largest average budgets in EMEA—81 million USD for 2021–22.
Most Schools Are Net Flow Positive
When we understand how funds flow to or from a business school, we also better understand the financial relationship that a business school has with its parent university. A zero, or balanced, net flow of funds means that the business school receives as much from its parent institution as it transfers to its parent institution; a positive net flow means that the business school contributes more funds to its parent institution than it receives; and a negative net flow means that the business school receives more funds than it contributes.
For the 2021–22 survey, the 74 participating schools that submitted data to the net flow portion of the survey reported a positive net flow of nearly 20 million USD. This means that, on average, business schools contribute about 20 million USD to their parent universities.
However, the range within that group is extensive. At one extreme, a school reported that it received 94 million USD from its parent institution. At the other, a school reported that it contributed 153 million USD to its parent institution.
The table below shows the percentage of business schools in our survey that fall into the balanced, negative, and positive net flow categories:
| FIGURE 2. NET FLOW OF FUNDS BETWEEN BUSINESS SCHOOLS AND PARENT UNIVERSITIES | ||||||||||
|---|---|---|---|---|---|---|---|---|---|---|
| 2017–18 | 2018–19 | 2019–20 | 2020–21 | 2021–22 | ||||||
| Total Number of Schools | n=110 | n=109 | n=98 | n=82 | n=74 | |||||
| Balanced Flow | 9% | 8% | 10% | 7% | 5% | |||||
| Negative Net Flow (funds are received from parent university) |
20% | 17% | 13% | 13% | 15% | |||||
| Positive Net Flow (funds are contributed to parent university) |
71% | 75% | 76% | 80% | 80% | |||||
| Private | n=41 | n=41 | n=35 | n=28 | n=27 | |||||
| Balanced Flow | 7% | 10% | 11% | 7% | 4% | |||||
| Negative Net Flow | 13% | 7% | 9% | 11% | 7% | |||||
| Positive Net Flow | 80% | 83% | 80% | 82% | 89% | |||||
| Public | n=69 | n=68 | n=63 | n=54 | n=47 | |||||
| Balanced Flow | 10% | 7% | 9% | 7% | 6% | |||||
| Negative Net Flow | 25% | 24% | 16% | 15% | 19% | |||||
| Positive Net Flow | 65% | 69% | 75% | 78% | 75% | |||||
Among reporting schools, it was most common to see a net flow of funds from the school back to the parent institution. While the same holds true among both private and public institutions, public schools were more likely than private schools to report a negative net flow of funds. Overall, these numbers show the extent to which a business school’s activity supports broader higher education efforts across campuses.
Tuition and Fees Generate the Most Funding
Business schools receive funds through a variety of avenues, but participating schools continue to report they generate the bulk of their funding from general tuition and fees—80 percent in 2021–22. That figure remained consistent across every major geographical region, and it has stayed relatively unchanged over the last five years.
We saw slight variation when we compared public and private institutions. On average, public institutions received 83 percent of their funds from tuition and fees, compared to 78 percent for private institutions. Tuition and fees make up a smaller proportion of funding for larger schools (74 percent) than for small and medium-sized schools (85 percent and 84 percent, respectively).
While other sources of business school funding were proportionally small, we saw some interesting differences across regions. In 2021–22, for example, nondegree education accounted for only 1 percent of funds for schools in the Americas but represented more than 5 percent of funding for schools in EMEA. Similarly, government grants and contracts were the source of 1 percent of funding, on average, for business schools in the Americas, but generated 6 percent of funding for schools in Asia Pacific.
In 2021–22, government grants and contracts were the source of only 1 percent of funding for schools in the Americas, but represented 6 percent of funding for schools in the Asia Pacific region.
Although survey responses came from around the globe, 84 percent of responses to questions in the “sources of funds” section came from schools in the Americas, with remaining participation coming from schools in the Asia Pacific and EMEA regions.
Where Are the Funds Going?
As mentioned above, the average budget of responding AACSB-member schools hovered at around 31 million USD. The ways schools allocated their budgets remained relatively steady over the past five years.
However, when we dug deeper into our 2021–22 survey findings, the following interesting trends emerged:
- Instructional activity accounted for more than half—55 percent—of average business school expenditures for reporting schools (n=172). Small business schools spent 63 percent of their total expenditures, on instructional activity. That compared to 47 percent for large schools and 57 percent for medium-sized schools.
- Technology accounted for a much smaller portion of total expenditures than we expected, given the greater dependence on digital learning over the past few years. On average, reporting schools (n=171) spent only a little more than 1 percent of their budgets on technology. This could reflect how business school’s budgets are structured, especially in relation to their parent institutions.
- Benefits and compensation accounted for 15 percent of total average expenditures for participating business schools (n=172). Business schools in the Americas spent significantly more (17 percent) on benefits and compensation than schools in EMEA (4 percent) and Asia Pacific (3 percent). Here, however, we must keep in mind that the survey had lower participation counts in EMEA (n=9) and Asia Pacific (n=12) than in the Americas (n=151). Overall, the average expense in this category for privately controlled schools was slightly lower (14 percent) than their public counterparts (16 percent).
Regarding the last two categories, we saw a significant range in spending. The maximum amount a school spent on technology hit 13 million USD, far more than the average of 714,000 USD. Likewise, the most a school allocated for benefits and compensation was 30 million USD, and the minimum was zero.
This substantial difference in spending indicates how variable the financial practices and structures are from institution to institution, particularly on a global scale.
A Glimpse Into a Complex Market
An examination of AACSB’s BSQ Finances Module provides data-informed answers to questions about the financial strategies of AACSB-member schools. And while there are substantial differences in spending across the broader business school community, the survey findings shed light on specific trends within smaller subsets of schools, which can be useful for comparison purposes.
We encourage schools to contribute to this ever-growing data set by participating in future AACSB surveys. We also invite them to use the benchmarking tools in DataDirect, which can help them refine their strategic planning and decision-making in an increasingly complex market for business education.