


Diversity: The Story in the Stats
- In the U.S., there has been growth of least 8 percent among underrepresented ethnicity groups across all levels of education, particularly among Hispanic students.
- More women are enrolling in business classes, becoming faculty, and serving as deans, but the gains are small.
- Worldwide, 15 million people between the ages of 20 and 34 hold master’s degrees in management education, with Asia and Latin America the primary sources for talent.
Business schools around the world have been making public commitments to improve diversity, equity, inclusion, and belonging (DEIB). Are their efforts paying off?
Recent data reports from AACSB and the Graduate Management Admission Council (GMAC) indicate that progress is being made, though sometimes the gains are small. More women are enrolling in management education programs and assuming academic leadership positions, but not in large numbers. And around the world, graduate management education (GME) continues to draw diverse populations—but there is more room to grow.
A Closer Look at the U.S.
Currently, AACSB’s diversity statistics center around U.S. schools, although the association plans to launch a survey later this year that will collect data from its global members. Recently, the association put together a data sheet that looks at how race and gender percentages in management education have changed over the past ten years. The information was drawn from AACSB’s annual Business School Questionnaire (BSQ) programs module and compares data collected from a controlled set of member schools in 2011–12 and 2020–21. In terms of racial diversity, the data indicate that there has been growth of at least 8 percent among underrepresented ethnicity groups across all levels of education, including within the generalist MBA degree.
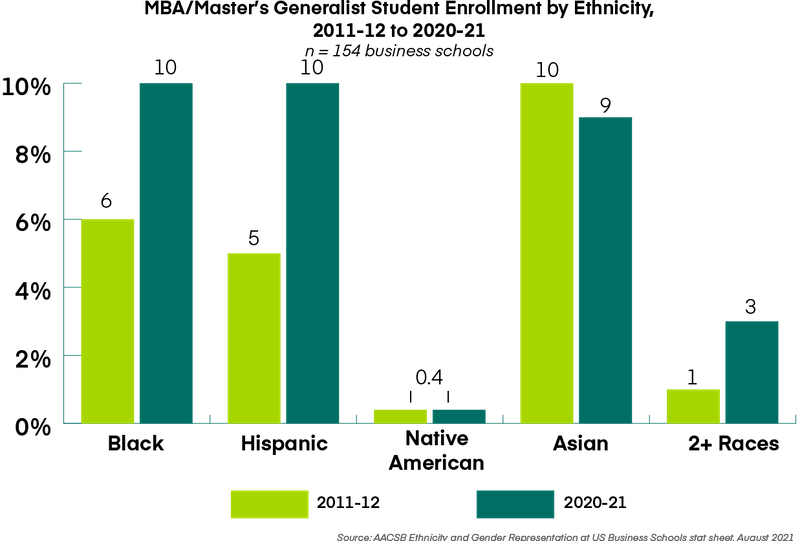
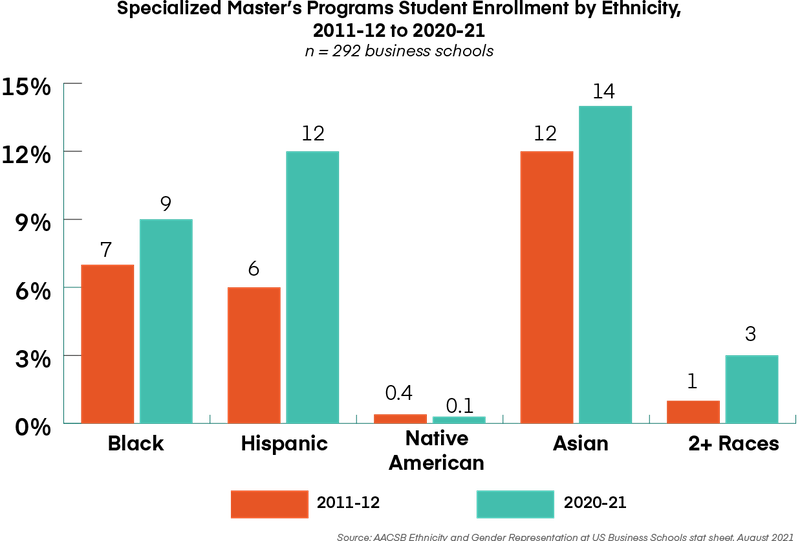
Specialized master’s programs were particularly impressive, showing increases of 13 percent among underrepresented ethnicity groups, as shown in the graphic below.
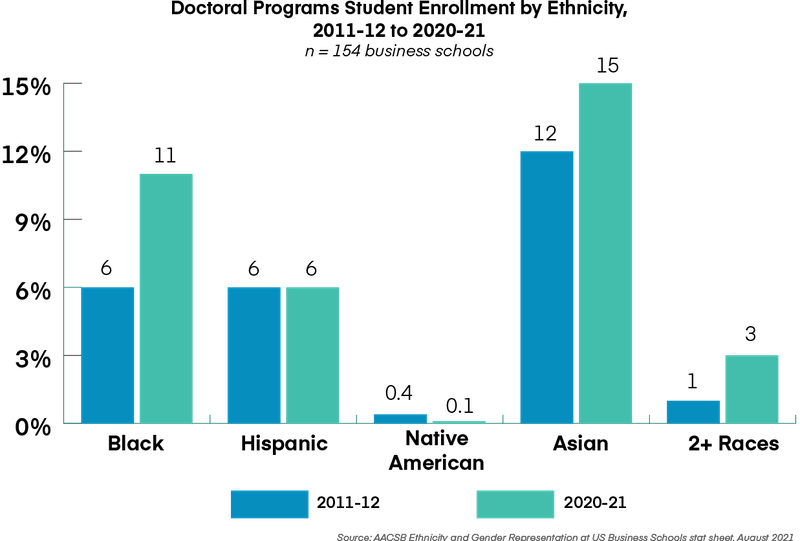
There also was a 5 percent increase in the number of Black students enrolled in doctoral programs, reflecting a rise from 6 percent to 11 percent.
But Hispanic students make up the fastest-growing underrepresented ethnicity group within business schools. During the 10 years between surveys, their representation in MBA and specialized master’s programs doubled. And while the numbers of Black, Asian, and Native American students in undergraduate programs did not significantly change in that time, the percentage of Hispanic students enrolled in undergraduate business programs rose from 10 percent to 15 percent.
It’s just as encouraging to note that diversity figures have improved across all parts of the U.S. Numbers have been particularly good in the Southwest and the West, where student enrollment for underrepresented ethnicity groups grew by 9 percent. What’s notable is that those increases outpaced the growth in the population of underrepresented ethnicity groups in those regions, according to the U.S. Census Bureau estimates.
Meanwhile, women have made gains, but those have been mostly incremental. For instance, over a five-year period, women’s enrollment in doctoral programs rose by only 2 percent. In addition, women’s enrollment in specialized master’s degree programs rose by 1 percent, putting women almost on a par with men at 49 percent of the total. The numbers are better for MBA programs as a whole, where there has been a 5 percent increase in female student representation over the past 10 years.
Women have made gains, but those have been mostly incremental. For instance, over a five-year period, women’s enrollment in doctoral programs rose by only 2 percent.
Not only have student populations in the U.S. diversified over the past decade, so have faculty rosters. There has been a 5 percent increase in the number of female professors, who now represent 34 percent of full-time faculty. While more tenured faculty currently are male, women are poised to make gains here as well: 27 percent of female faculty members are on the tenure track, compared to 22 percent of the men. And women are making some inroads into leadership positions: In the past 10 years, the percentage of deans who identify as female increased from 18 percent to 28 percent.
During this same period, the percentage of faculty who come from underrepresented ethnicity groups has risen from 19 percent to 26 percent. The percentage of Asian faculty has climbed the most, from 14 percent to 19 percent, but gains have been relatively small for other groups. For Black faculty, the figures went from 3 percent to 4 percent; for Hispanics, from 2 percent to 3 percent. The numbers actually dropped for Native American business school faculty, from 0.4 percent to 0.2 percent. Clearly, there is still work to be done to improve diversity in front of the classroom as well as within it.
A Global Perspective
A somewhat broader outlook comes from GMAC, which published a special report in October 2021 to chronicle who is enrolling in graduate management education. The report provides one global overview, seven regional overviews, separate reports for 69 locations, and data reviews for 106 additional countries.
The goal of the publication is to advocate for the value of GME to underrepresented populations around the globe, according to Sangeet Chowfla, GMAC’s president and CEO. A diverse student body “lifts us all,” he notes in the introduction to the report. “It creates a richer student experience and increases sensitivity to the issues that affect others.”
Approximately 26 percent of those who hold bachelor’s degrees worldwide studied in the fields of business, administration, or law.
The GMAC report highlights several key facts about the populations that enroll in GME:
- Worldwide, an estimated 15 million people aged 20 to 34 hold master’s degrees in management education. The ten countries with the largest supply of GME master’s-degree holders within the student-age population are China, India, the U.S., Brazil, Indonesia, Iran, Russia, Japan, the U.K., and Bangladesh.
- Approximately 26 percent of those who hold bachelor’s degrees worldwide studied in the fields of business, administration, or law (BAL). The world’s three largest sources of bachelor’s-degree holders in these fields come from East Asia and the Pacific, Central and South Asia, and Europe. In fact, in East Asia and the Pacific, an estimated 4 million people aged 20 to 34 have GME degrees.
- The Central and South Asia region is a major source of talent for GME, because this part of the world supplies approximately 25 percent of the world’s bachelor’s degrees in the BAL fields.
- Latin America is another prime source for GME talent. For instance, in Honduras, Nicaragua, El Salvador, and Bolivia, 28 percent of all bachelor’s degree-holders have studied BAL fields.
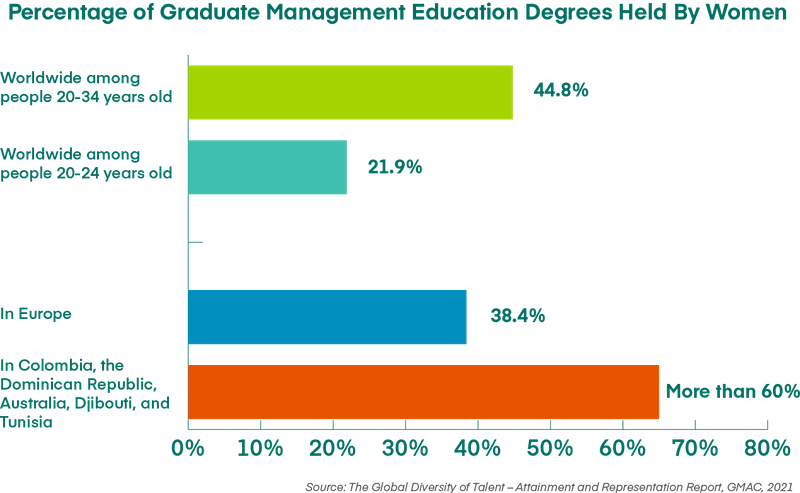
The GMAC report also considers the gender gaps in graduate management education. The graphic below shows that the gender gaps are worse among the “early talent cohort”—those aged 20 to 24—and in certain countries, including Europe.
It’s interesting to note that women pursue undergraduate BAL degrees at a rate comparable to men. Globally, 26.4 percent of bachelor’s degrees earned by women are in BAL fields, compared to 24.6 percent for men. However, of those earning master’s degrees, 29.4 percent of women and 33.7 percent of men pursue degrees in BAL. These data suggest that when it comes to the funnel for GME studies, something is blocking women from taking the next step.
Finally, the GMAC report takes a closer look at GME statistics for race and gender in the U.S. In particular, it considers the “GME participation rate”—that is, the proportion of GME degree-holders relative to the student-aged population. Two pieces of data stand out:
- In the U.S., the highest GME participation rate is seen among Asian Americans, as 4.5 percent of the group’s student-aged population hold GME degrees. The participation rate is 3 percent among Blacks; 2.5 percent among whites; 1.3 percent among Hispanic Americans, American Indians, and Alaska Natives; and 0.7 percent among others or those who identify as being two or more races.
- Black women hold 62.8 percent of the GME degrees within their racial group, while American Indian or Alaskan Native women hold 52.7 percent. Compare that to Asian American women, who hold 49.3 percent of GME degrees, and white women, who are the lowest at 44.1 percent.
According to Chowfla, the goal of the diversity report was to provide the GME community with an understanding of where the field is today. And, he says, it encourages educators in the field to ask, “Where do we excel, and where do we have work to do?”